The Amsterdam Excel Summit 2018

Hi Excel lovers,

Wanted to draw your attention to our fifth

Amsterdam Excel Summit

June 7 and 8 , 2018

We’ve worked hard to get an exciting line-up of speakers presenting on a wide variety of Excel subjects during our two-day conference.

So if you’re an Excel power-user, this is one of those one-of-a-kind conferences you cannot afford to miss!

Registration is now open

Hope to see you in Amsterdam on June 7 and 8 2018!

Jan Karel Pieterse, Tony de Jonker

topexcelclass.com

The Amsterdam Excel Summit 2017

Hi Excel lovers,

Wanted to draw your attention to our fourth

Amsterdam Excel Summit

April 18 and 19, 2017

We’ve worked hard to get an exciting line-up of speakers presenting on a wide variety of Excel subjects during our two-day conference.

So if you’re an Excel power-user, this is one of those one-of-a-kind conferences you cannot afford to miss!

Registration is now open

Hope to see you in Amsterdam on April 18 and 19 2017!

Jan Karel Pieterse, Tony de Jonker

topexcelclass.com

Formula Auditing by RefTreeAnalyser: Objects included

Hi all,

I’ve been working on my RefTreeAnalyser again. What I’ve been up to this time is building tools which help with the analysis of dependencies which are mostly hidden from view:

  • Charts (series formula)
  • Pivot table (source data)
  • Data Validation formulas
  • Conditional Formatting formulas
  • Form controls (linked cell, listfillrange)
  • ActiveX controls (linked cell, listfillrange)
  • Picture objects (linked cell)

A new dialog has been added that shows all sources of the objects in your file:

Objects analysed for cell dependencies

Moreover, when you analyse a particular cell for its dependencies, objects are taken into account too (well, to be perfectly honest, only if you purchase a license):

RTAObjectsInRefs

If you haven’t already done so, why don’t you head over to my website and download the tool. The demo is free and (almost!) fully functional.

Regards,

Jan Karel Pieterse
www.jkp-ads.com

Improving the Trace Precedents Experience

Hi all,

I’ve been working on my RefTreeAnalyser in the past weeks. One thing I’ve been working on is improving the not-so-intuitive way Excel displays Precedents using arrows, especially if a cell has mutliple off-sheet precedents:

Excel's way to show precedents

Notice that silly goto dialog (which you get when you double-click the off-sheet arrow with the tiny “table” icon next to it)?
Prize question: which worksheets and ranges are the entries in the Goto listbox pointing to?

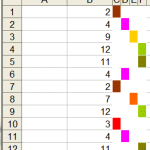
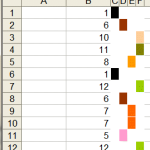
I redesigned that “experience” to this (I manually added the red call-outs to this screenshot to explain what is what):

My way to show Precedents

Note how off-sheet precedents are represented by a picture of (part of) the range in question. A nice way to enable you to see what the precedent values are.

The boxes contain a hyperlink to that range so a simple click takes you there for further inspection. On hover with your mouse you’ll get the precedent’s source address in a tooltip.

If you like this idea, why not head over to my site and download the demo version so you can try it and shoot some comments at me?

There is one snag: the new feature only works for Excel 2007 and up.

Regards,

Jan Karel Pieterse
www.jkp-ads.com

Generate random numbers in MS Excel

A common requirement is to generate a set of random numbers that meet some underlying criterion. For example, a set of numbers that are uniformly distributed from 1 to 100. Alternatively, one might want random numbers from some other distribution such as a standard normal distribution.

While there are specialized algorithms to generate random numbers from specific distributions, a common approach relies on generating uniform random numbers and then using the inverse function of the desired distribution. For example, to generate a random number from a standard normal distribution, use =NORM.S.INV(RAND())

Another common requirement is the generation of integer random numbers from a uniform distribution. This might be to select people for something like, say, training, or a drug test. Or, it might be to pick a winner for a door prize at a social event. It might also be to assign players to groups for a sport tournament such as golf.

For a version in a page by itself (i.e., not in a scrollable iframe as below) visit http://www.tushar-mehta.com/publish_train/xl_vba_cases/0806%20generate%20random%20numbers.shtml

Tushar Mehta

Draw a circle in an Excel chart

By default, Excel has a limited number of charts. That does not mean that those are the only charts one can create. It turns out that with a little imagination and creativity, we can format and configure the default charts so that the effect is like many other kinds of charts.

One of the more versatile of charts is the XY Scatter chart. We can use it as the base for many data visualization tasks. Recently, for a client, I used one to create a radial org chart as in Figure 1. Such a chart is also called a Node-Link chart or a Reingold–Tilford Tree.

image001
Figure 1 – Example of a radial org graph created in an Excel XY Scatter chart
after removal of all identifiable information and the obfuscation of data
necessary to protect the client’s confidentiality.

A lot of “out of the box” work into making this chart. One key element was the set of equidistant concentric circles that provide a visual reference for the small colored dots. This note demonstrates how to create concentric circles in an Excel XY Scatter chart.

For a version in a page by itself (i.e., not in a scrollable iframe as below) visit http://www.tushar-mehta.com/publish_train/xl_vba_cases/0610%20draw%20circle.shtml

Tushar Mehta

Worksheet as a chart – multiple conditional formats

Several years back, I wrote an article on how to use multiple cells to simulate conditional formats that involved more than 3 conditions. Three versions of Excel later, I still receive requests related to this post. So, I updated it to include more screenshots and a downloadable file.

In Excel 2003 and earlier, conditional formatting works well for up to three conditions. But even when the number of conditions exceeds that limit, it is possible to do without any programming support. For example, one possible way to show twelve possible rankings through color is shown below.

img7img8img9

For more see http://www.tushar-mehta.com/excel/newsgroups/worksheet_as_chart/

Tushar Mehta