Hey Dick, thanks for having me over. Wow, it’s even nicer in here than I imagined. Look at all those posts! Hey, is that an Office XP beer stein… where’d you get that? Gosh, do you really wear all these baseball caps?
Okay, well great to be here. I hope I don’t blow it. I’m going to talk about a fairly pedestrian topic, but one I deal with daily as a data analyst and report writer: comparing versions of output data.
At my work we have a report modification and publication process to verify that they’re outputting reasonable results. A lot of times this means comparing a report to its previous published version and confirming that the outputs are identical before moving on with the process.
I’ll show some tricks I use to do these comparisons. Please note these examples all assume the data you’re comparing is easily re-creatable, e.g., it comes from a data connection or was exported from another tool. In other words, don’t do these tests on the only copy of your output!
The Most Basic of Tricks – Comparing Sums
One quick trick you’ve probably used is to grab an entire column of output and check its SUM in the status bar. Aside from comparing row counts, this is about as simple as it gets.
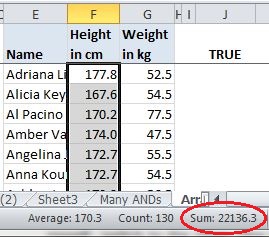
I usually just look at the first three or so digits and the last three or so, mumble them to myself, switch to the other column and mumble those to myself. If my mumblings match, I call it good.
Mind you, I only do this as an informal check. Still, writing this got me to wondering how reliable it is, and about the likelihood of a false positive, a coincidental match. So I did a little test and filled two columns with RandBetween formulas then wrote a bit of VBA to recalculate them repeatedly and record the number of times their sums matched. With two columns of 1000 numbers, each filled with whole numbers between 1 and 1000, I averaged around three matches per 100,000 runs, or a .003% chance of a coincidental match. That’s a pretty small range of numbers though, equivalent to a span from one cent to ten dollars. So I upped it to whole numbers between one and a million, similar to one cent to 10,000 dollars. With a million calculations of 1000 rows there were no coincidental matching totals.
A More Thorough Trick – Compare All Cells
When I really want to make sure two sets of data with the same number of rows and columns match cell for cell, I do the obvious and … compare every cell. That could look something like this (but eventually won’t, so stick with me):
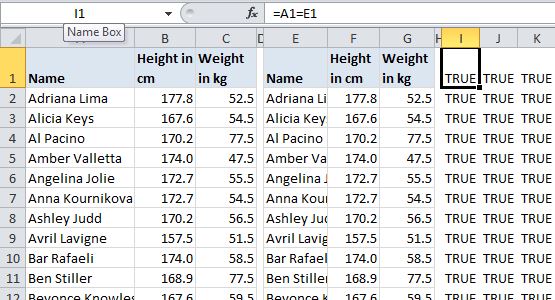
The two sets of data (a modified version of the indispensable table from celeb-height-weight.psyphil.com) are on the left, with the comparison formulas for each cell on the right. In this case they all match and return TRUE:
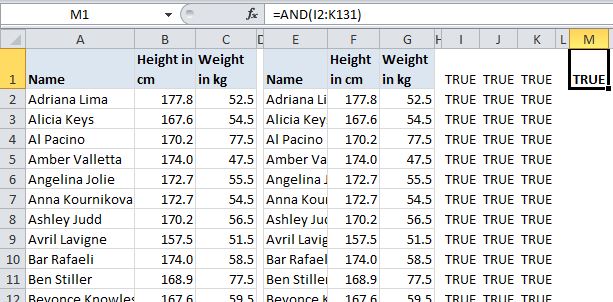
If you’ve got more than a few columns and rows, you probably don’t want to scan all the comparison cells for FALSEs. Instead, you can wrap up all these comparisons in a single AND, like this. It will return FALSE if any of the referenced cells are FALSE:
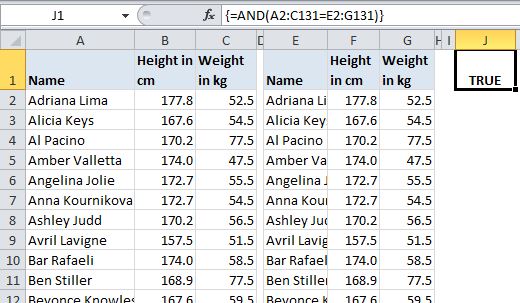
Or just eliminate the middleperson altogether with a single AND in an array formula:
What If They Don’t All Match?
If they don’t all match you can add conditional formatting to highlight the FALSEs…
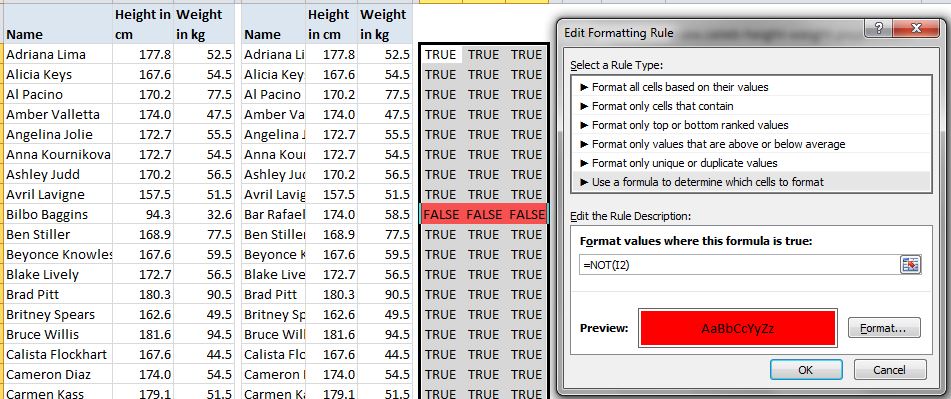
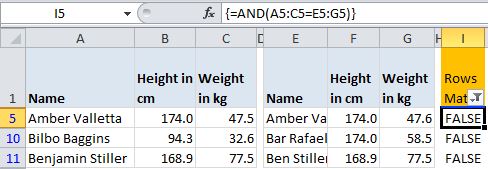
… or just add it directly to the two tables. However, rather than conditional formatting I’d use a per-row AND array formula and filter to FALSE:
Same Data, Different Order
Sometimes my rows of data are the same, but they’re out of order. I try not to yell at them like Al Pacino. Instead I might test them with a COUNTIF(S) formula, like so, which just counts how many times the name in a the second table appears in the first table:
=COUNTIF($A$2:$A$131,E2)
To compare whole rows, you’re stuck (I think) with longer COUNTIFS formulas than I care to deal with. I’d rather concatenate the rows and compare the results with a COUNTIF. I don’t have many worksheet UDFs in my tools addin, but one exception is Rick Rothstein’s CONCAT function, which I found on Debra’s blog. It’s great because, unlike Excel’s Concatenate function, it allows you to specify a whole range, rather than listing each cell individually.
COUNTIFs can get slow though once you’ve got a few thousand rows of them. So, another approach is just to sort the outputs identically and then use an AND to compare them. Here’s a function I wrote to sort all the columns in a table:
Sub BlindlySortTable()

Dim lo As Excel.ListObject

Dim loCol As Excel.ListColumn
Set lo = ActiveCell.ListObject
With lo
.Sort.SortFields.Clear
For Each loCol In .ListColumns
.Sort.SortFields.Add _
Key:=loCol.DataBodyRange, SortOn:=xlSortOnValues, Order:=xlAscending, DataOption:=xlSortNormal
Next loCol
With .Sort
.Header = xlYes
.MatchCase = False
.Apply
End With
End With
End Sub
At this point I should mention that I almost always work with Tables (VBA ListObjects) when doing these comparisons. A lot of the time I’ve stuffed the SQL right into the Table’s data connection. If the data is imported from something like Crystal Reports, I’ll convert it to a table before working with it.
Using Pivot Tables For Comparing Data – Fun!
As I get farther along in a report’s development, odds are I might just want to compare a subset of the old version to the whole new version, or vice-versa. Using pivot tables is great for this. Say for instance my new report is only for people whose weight is under 48 kilograms. I’d like to compare the output of the new report to a filtered list from the older version and confirm that I’m returning the same weights for the people in the new subset. A pivot table makes this easy:
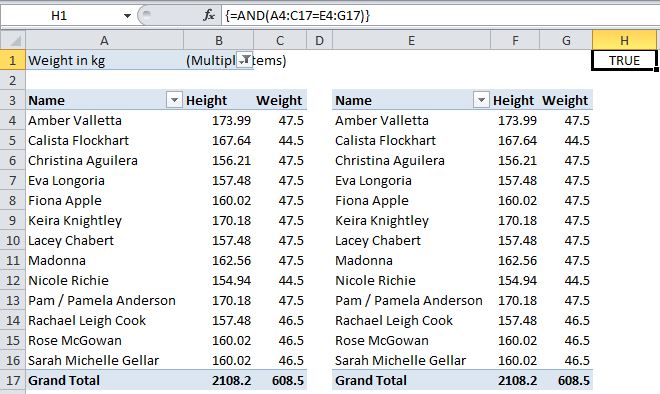
The pivot on the left, based on the original data, has been filtered by weight and compared to the pivot on the right, based on the new, less-than-48 data. An AND formula confirms whether the data in the new one matches the original.
I was doing this the other day with multiple subsets, causing the pivots to resize. I thought “wouldn’t it be cool to have a function that returns a range equal to a pivot table’s data area?” The answer was “yes,” so I wrote one. It returns either the used range or the data area of a table or pivot table associated with the cell passed to it. Here’s the code:
Public Enum GetRangeType

    UsedRange    '0

    'CurrentRegion - can't get to work in UDF in worksheet, just returns passed cell

    PivotTable    '1

    ListObject    '2

End Enum
Public Function GetRange(StartingPoint As Excel.Range, RangeType As GetRangeType) As Excel.Range
Dim GotRange As Excel.Range
With StartingPoint
Select Case RangeType
Case GetRangeType.UsedRange
Set GotRange = .Worksheet.UsedRange
Case GetRangeType.PivotTable
Set GotRange = .PivotTable.TableRange1
Case GetRangeType.ListObject
Set GotRange = .ListObject.Range
End Select
End With
Set GetRange = GotRange
End Function
The array-entered formula in H1 in the picture above becomes…
=GetRange(A3,1)= GetRange(E3,1)
… where 1 is a pivot table. You’ll note that the code itself uses the enum variable, which would be great if you could use the enums in a UDF. Also, you’ll see that I tried to have a cell’s CurrentRegion as an option but that doesn’t work. When returned to a UDF called from a worksheet, CurrentRegion just returns the cell the formula is in.
So Long
Okay then, see you later Dick. Thanks again for the invite. It means a lot to me.
No, no, don’t get up… I can show myself out and it looks like you’re working on something there. Wait a minute… no it couldn’t be… for a second there it looked like you were using a mouse… Must have been a trick of the light.
Cheers!


 TM Goal Seek enhances the existing user interface to Excel’s Goal Seek feature. The built in Goal Seek is a simple optimization tool that suffices for a large number of scenarios. The UI, unfortunately, is extremely unwieldy and unfriendly. TM Goal Seek is a simple add-in that is easier to use than the default dialog box because of three critical benefits: