Generate random numbers in MS Excel

A common requirement is to generate a set of random numbers that meet some underlying criterion. For example, a set of numbers that are uniformly distributed from 1 to 100. Alternatively, one might want random numbers from some other distribution such as a standard normal distribution.

While there are specialized algorithms to generate random numbers from specific distributions, a common approach relies on generating uniform random numbers and then using the inverse function of the desired distribution. For example, to generate a random number from a standard normal distribution, use =NORM.S.INV(RAND())

Another common requirement is the generation of integer random numbers from a uniform distribution. This might be to select people for something like, say, training, or a drug test. Or, it might be to pick a winner for a door prize at a social event. It might also be to assign players to groups for a sport tournament such as golf.

For a version in a page by itself (i.e., not in a scrollable iframe as below) visit http://www.tushar-mehta.com/publish_train/xl_vba_cases/0806%20generate%20random%20numbers.shtml

Tushar Mehta

Excel corrupts certain workbooks in migrating from 2003 to 2007

I got a email from a client asking for help because Excel was “destroying,” to use his terminology, his 2003 workbook after conversion to the 2007 format. And, after analyzing the kind of change Excel made, I had to agree.

The following in 2003
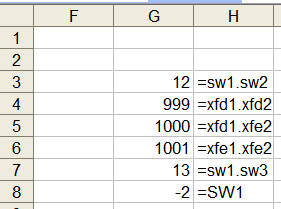
badnames 1
Figure 1

becomes, in 2013 (and in 2010),
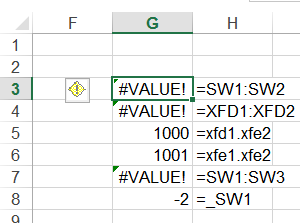
badnames 5
Figure 2

The basic problem is that names that are legitimate names in Excel 2003 may become unacceptable in 2007 (or later). But, a more devastating problem is with a formula using a name with a dot in it. Even though it is completely legitimate, Excel changes the dot to a colon. This causes the formula =SW1.SW2 to become =SW1:SW2. Don’t ask me why. It just does. The result is the formula is all wrong and destroys the integrity of the workbook.

It appears that the cause may be Excel trying to help manage the transition of a XLS workbook into the newer format. In 2007, Microsoft increased the number of columns from 256 to 16,384. Consequently, the reference to last column went from IV to XFD. So, a name such as SW1, completely OK in 2003, became unacceptable in 2007. On converting a XLS file to a XLSX file, Excel will convert such names by adding an underscore at the start of the name. But, it seems to go beyond that, converting formula references to certain names with dots in them to a colon. This happens if both the tokens to the left and to the right of the dot could be legitimate cell references. So, Excel converts the formula =XFD1.XFD2 to =XFD1:XFD2 but it will leave =XFD1.XFE2 alone.

To replicate the problem:

  • Start with Excel 2003. Create a workbook and add the names shown in the Figure 1. Save and close the workbook.
  • Open the workbook in Excel 2013. Save it as a XLSX file. Acknowledge the warning message (see Figure 3),
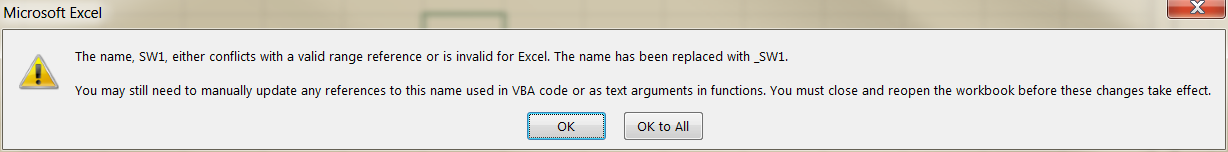
    badnames 3
    Figure 3

  • Close and reopen the new XLSX workbook. The formulas will have the errors shown in Figure 2.

The safest way to work around this problem is to add an underscore before every name in the workbook before making the transition to the 2007 format. Obviously, the quickest way to do this would be with a very simple VBA procedure. But, through trial and error I discovered the code will not work in 2003. It runs without any problems but it doesn’t do anything!

So, the correct way to use the code is the following sequence.

  • Open the XLS file in 2013 (or 2010).
  • Run the macro below.
  • Now, save the file in the newer format. If your original workbook had no code in it, save the file as a XLSX file and acknowledge the warning that the VB project will be lost.
  • Close and reopen the file. You should see the correct data with all the names now starting with an underscore.
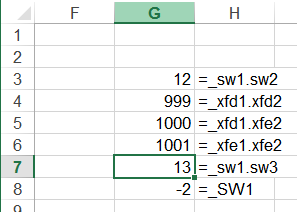
    badnames 7
    Figure 4

Tushar Mehta

Model business dependencies in an Excel worksheet

The Civilization game dependency tree
How to build a dependency tree when there is no obvious connection between the business model and an Excel model.

A long time ago I spend a lot of time playing the strategy game Civilization. For those not familiar with the game, one of its features was “advances.” Each advance brought with it certain additional capabilities and benefits. Of course, there was a requirement before one could acquire an advance, particularly a set of pre-requisites. For example, pre-requisites for the “Navigation” advance were the “Seafaring” and the “Astronomy” advances. In turn, the Seafaring advance required one to already know “Pottery” and “Map Making”.

I created an Excel worksheet that let me use Excel’s Precedent arrows to understand the optimal path to specific advances as in Figure 1. The advances are shown in red and the benefit(s) of each advance are in black, blue and green. The Excel blue arrows show the pre-requisites for the Seafaring advance.

Figure 1

While the dated worksheet may be of limited value even to Civilization enthusiasts, the technique for creating the dependency tree is unique enough to be of value to Excel consumers. What makes it of value is that the game dependencies (in the context of work this would be the dependencies in the business model) had nothing to do with what Excel considers as dependencies! Consequently, to use Excel’s Trace Precedents feature I had to somehow map the model dependency into Excel formula dependencies.

For a version in a page by itself (i.e., not in a scrollable iframe as below) visit http://www.tushar-mehta.com/publish_train/xl_vba_cases/0908%20CIV%20game%20dependency%20tree.shtml

Tushar Mehta

Excel Advanced Filter

Excel supports two different ways to filter data that are in tabular format. Autofilter is a built-in capability driven via the user interface. As sophisticated as Autofilter has become in recent versions of Excel, no pre-defined setup can possibly cater to all the different questions that the consumer may want answered. These require a custom filter and Advanced Filter provides that capability. It is a data-driven mechanism that uses Excel formulas to extract specific information from the original data. For those who may have heard of SQL but have never been motivated to learn it, you can now leverage some of the power of SQL without learning a single word of SQL!

The layout of this document is as follows: 1) Introduction to the data set used in the examples, 2) Introduction to the Advanced Filter dialog box, 3) Filter using column headers, 4) Filter using Excel formulas, 5) Extract unique data, 6) Work with dynamic source data, and 7) Create a filter in a different worksheet or workbook.

For a version in a page by itself (i.e., not in a scrollable iframe as below) visit http://www.tushar-mehta.com/publish_train/data_analysis/06.shtml

Tushar Mehta

Unicode and diacritic characters

The primary role of Excel is analysis and visualization of data, which put less emphasis on the use of special text characters. Nonetheless, there will always be some need for special characters, both Unicode characters and diacritics in Excel.

A diacritic in English is a glyph that modifies the sound of the character to which it is attached. Examples are naïve, résumé, and saké. In other fields, glyphs modify a letter to convey a specific meaning. Examples include:

· In Statistics the sample mean is denoted by x-bar (x̄) and the sample proportion by p-hat (p̂). Examples of Unicode characters are the population mean (the lowercase Greek letter mu, μ) and the population standard deviation (the lower case Greek letter sigma, σ).
· In Economics, profit is denoted by the Greek letter pi (π).
· In Mathematics, well, in Mathematics, there are a plethora of symbols including the capital sigma (Σ) for sum and ∫ for an integral.
· Currencies are denoted by symbols such as the US Dollar ($), the Euro (€), the Japanese Yen (¥), the Chinese Yuan (元), and the Indian Rupee (₹).

For a version in a page by itself (i.e., not in a scrollable iframe as below) visit http://www.tushar-mehta.com/publish_train/xl_vba_cases/0123%20Unicode%20and%20diacritics.shtml

Tushar Mehta

Freeze Panes and Split Panes

When working with a worksheet that contains a large number of rows and/or a large number of columns with row and column headers, it is very helpful to always view the headers no matter where one scrolls through the document.

An example is shown below. The table lists the year-by-year carbon dioxide emissions by country (the data set comes from data download page at Gapminder – http://www.gapminder.org/data/). The current worksheet view shows data from the 1950s (columns GQ through GZ) and countries that are alphabetically towards the end of the list of countries (rows 235 through 259). At the same time, the column headers (row 1) and the row headers (column A) are still visible. This lets one quickly establish a context for the numbers. This is the result of using Excel’s Freeze Panes feature.

A complementary feature is called Split Panes. The key differences between freeze pane and split pane are the somewhat different behavior while scrolling and an easier way to adjust the panes, which, of course, comes with extra responsibility to manage the risk of accidental changes to the split panes configuration.

For a version in a page by itself (i.e., not in a scrollable iframe as below) visit http://www.tushar-mehta.com/publish_train/xl_vba_cases/0201%20split%20freeze%20pane.shtml

Tushar Mehta

Minimum and maximum values of numeric data types

There has been many an occasion when I have wanted programmatic access to the maximum or minimum or smallest value of a data type. Some programming languages have built-in support through names like MaxInt. VBA, unfortunately, is not one of them.

I decided to “translate” the documentation defining the different data types into code. The functions Max{datatype}, Min{datatype}, and Smallest{datatype} return the appropriate value. The Max and Min functions should be self-evident. The Smallest function returns the smallest non-zero value supported by the data type. Since this is simply 1 for all data types associated with integers (Byte, Integer, Long, LongPtr, LongLong, and Currency), Smallest is defined only for data types associated with real numbers (Single, Double, and Decimal).

For a version in a page by itself (i.e., not in a scrollable iframe as below) visit http://www.tushar-mehta.com/publish_train/xl_vba_cases/1003%20MinMaxVals.shtml

Tushar Mehta