Generate random numbers in MS Excel

A common requirement is to generate a set of random numbers that meet some underlying criterion. For example, a set of numbers that are uniformly distributed from 1 to 100. Alternatively, one might want random numbers from some other distribution such as a standard normal distribution.

While there are specialized algorithms to generate random numbers from specific distributions, a common approach relies on generating uniform random numbers and then using the inverse function of the desired distribution. For example, to generate a random number from a standard normal distribution, use =NORM.S.INV(RAND())

Another common requirement is the generation of integer random numbers from a uniform distribution. This might be to select people for something like, say, training, or a drug test. Or, it might be to pick a winner for a door prize at a social event. It might also be to assign players to groups for a sport tournament such as golf.

For a version in a page by itself (i.e., not in a scrollable iframe as below) visit http://www.tushar-mehta.com/publish_train/xl_vba_cases/0806%20generate%20random%20numbers.shtml
Tushar Mehta

Draw a circle in an Excel chart

By default, Excel has a limited number of charts. That does not mean that those are the only charts one can create. It turns out that with a little imagination and creativity, we can format and configure the default charts so that the effect is like many other kinds of charts.

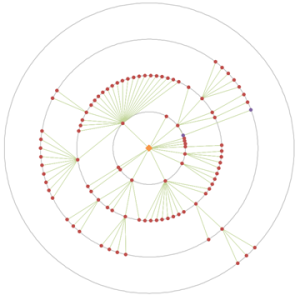
One of the more versatile of charts is the XY Scatter chart. We can use it as the base for many data visualization tasks. Recently, for a client, I used one to create a radial org chart as in Figure 1. Such a chart is also called a Node-Link chart or a Reingold–Tilford Tree.

image001
Figure 1 – Example of a radial org graph created in an Excel XY Scatter chart
after removal of all identifiable information and the obfuscation of data
necessary to protect the client’s confidentiality.

A lot of “out of the box” work into making this chart. One key element was the set of equidistant concentric circles that provide a visual reference for the small colored dots. This note demonstrates how to create concentric circles in an Excel XY Scatter chart.

For a version in a page by itself (i.e., not in a scrollable iframe as below) visit http://www.tushar-mehta.com/publish_train/xl_vba_cases/0610%20draw%20circle.shtml

Tushar Mehta

Worksheet as a chart – multiple conditional formats

Several years back, I wrote an article on how to use multiple cells to simulate conditional formats that involved more than 3 conditions. Three versions of Excel later, I still receive requests related to this post. So, I updated it to include more screenshots and a downloadable file.

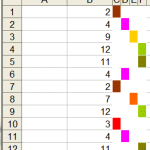
In Excel 2003 and earlier, conditional formatting works well for up to three conditions. But even when the number of conditions exceeds that limit, it is possible to do without any programming support. For example, one possible way to show twelve possible rankings through color is shown below.

img7img8img9

For more see http://www.tushar-mehta.com/excel/newsgroups/worksheet_as_chart/

Tushar Mehta

Excel Advanced Filter

Excel supports two different ways to filter data that are in tabular format. Autofilter is a built-in capability driven via the user interface. As sophisticated as Autofilter has become in recent versions of Excel, no pre-defined setup can possibly cater to all the different questions that the consumer may want answered. These require a custom filter and Advanced Filter provides that capability. It is a data-driven mechanism that uses Excel formulas to extract specific information from the original data. For those who may have heard of SQL but have never been motivated to learn it, you can now leverage some of the power of SQL without learning a single word of SQL!

The layout of this document is as follows: 1) Introduction to the data set used in the examples, 2) Introduction to the Advanced Filter dialog box, 3) Filter using column headers, 4) Filter using Excel formulas, 5) Extract unique data, 6) Work with dynamic source data, and 7) Create a filter in a different worksheet or workbook.

For a version in a page by itself (i.e., not in a scrollable iframe as below) visit http://www.tushar-mehta.com/publish_train/data_analysis/06.shtml

Tushar Mehta