The Range.Find method and a FindAll function

Two things that could be better about the Range.Find method have been 1) up-to-date and correct documentation, and 2) adding the UI’s ‘Find All’ capability to the Excel Object Model. As of Office 2013 neither has happened.

Consequently, every time I want to use the Find method, I continue to have to jump through hoops to figure out the correct values for the different arguments.

I also discovered that FindNext does not work as expected when one wants to search for cells that meet certain format criteria. Consequently, I updated my long available FindAll function so that it works correctly with format criteria.

For a version in a page by itself (i.e., not in a scrollable iframe as below) visit http://www.tushar-mehta.com/publish_train/xl_vba_cases/1001%20range.find%20and%20findall.shtml

Tushar Mehta

Do consumers prefer the ease of an EXE installer or the transparency of a ZIP file?

For all the various add-ins available from my website, I have supported two downloadable formats, an EXE and a ZIP file. The EXE is easier to install and includes an uninstall capability. The ZIP hopefully provides the consumer greater transparency and control over what is on their computer.

In addition to the software downloadable from my website, I also develop custom solutions through my consulting work. Most of my projects are sponsored by senior executives in companies or otherwise people with substantial decision making authority. It turns out that even a Managing Director or an Executive Vice President is subject to the automated IT protocols in effect in their organization (e.g., Group Policy).

Small and midsize companies are more tolerant of the kinds of files their employees can download. So, it is my larger clients who prefer — actually, require — a solution acceptable to their respective corporate IT filters. That means no EXE and no MSI, not even inside a ZIP file.

That has been a major stumbling block in my migration to .Net. For all the advantage of the platform, providing an add-in inside a ZIP file is not one of them.

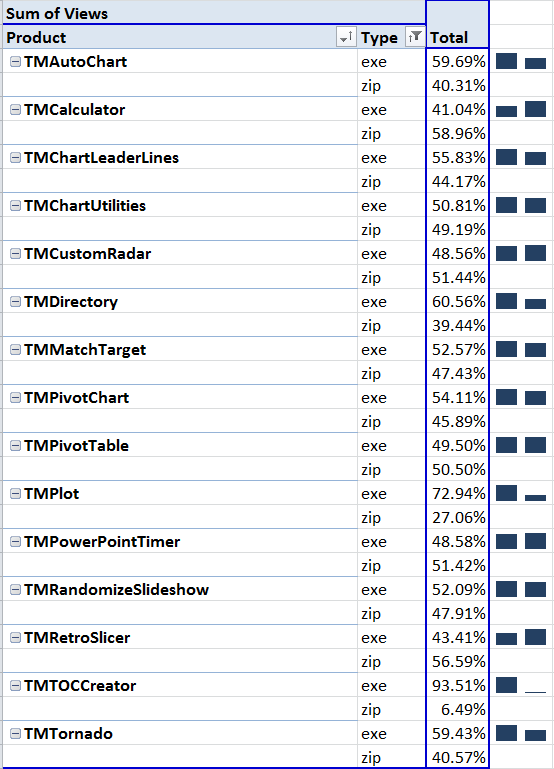
I wondered if that inability (or reluctance) to download an EXE extended to those who download software from my website. Using Google Analytics I decided to check their download preference/requirement. Would the data indicate a strong preference for EXE over ZIP or the other way around? Turns out the result is decidedly mixed! As the table below shows, with the exception of TM Plot and TM TOCCreator, the download choice is about 50-50!

The table below is a PivotTable based on Google Analytics data for my website. For each add-in the table lists the EXE and the ZIP download percentages together with a sparkline for the two formats.
The 2012 Financial Modeling World Championships

http://www.modeloff.com/

I “pre registered” even though there’s not a lot of information on the site. For example, I could not find any information about the organizers, nor could I find any motivational details other than “The prize pool…will include cash, interviews with leading global Financial Institutions, product giveaways and more.” Neither is there any information about how the finalists will participate in the “Live Judged Event in New York.”

Of course, the competition, by necessity, will be measure ability / skill along whatever dimension(s) the organizers value. Nonetheless, it might be fun and an opportunity to see what others do in such an event.

Tushar Mehta

Survey on Excel use

An INFORMS SPRIG email contained a request for a survey on Excel use from Abigail Rose Rebello, a graduate student at Cardiff, who needs the responses for her dissertation. It took me under 10 minutes, interrupted by 2 phone calls, to complete the survey.

From the email I received:
— quote —
Understanding Spreadsheet Usage – Survey

Spreadsheets are crucial elements of today’s business world and grow in importance every day. The usage, development and management techniques of each spreadsheet user appear to be unique. We are interested in studying these diverse characteristics via a global survey. The information you provide will help the student conducting this research to understand the wide ranging differences and similarities be tween different classes of spreadsheet users and developers. It would be really helpful if you took the time to answer a few questions via the survey link posted below.

http://www.surveymethods.com/EndUser.aspx?E0C4A8B1E1AAB1B7E4

– end quote –

Tushar Mehta

Excel Services Interactive View

Analyze data with Excel on the web

Microsoft has introduced a new web based capability that extends its Excel Services offering.  This new capability provides a limited interactive view of any table in a web page.

An introduction to this service is below.  For those interested in additional capabilities and more advanced and useful capabilities see:

For the consumer:

Learn more about Interactive View

Analyze a table in any web page with a dynamic interactive view

For the developer:

Implement the Interactive View feature for 1 table

Implement the Interactive View feature for multiple tables

Improve the formatting and layout of the 'Interactive View' buttons

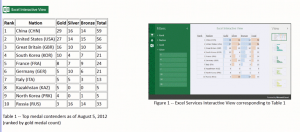
As an example, the image below shows a table, the Interactive View button, and the result.

For a live demo, developer tips, and more, please see http://www.tushar-mehta.com/publish_train/data_visualization/15c%20interactiveview/index.htm

Tushar Mehta

Model business dependencies in an Excel worksheet

The Civilization game dependency tree
How to build a dependency tree when there is no obvious connection between the business model and an Excel model.

A long time ago I spend a lot of time playing the strategy game Civilization. For those not familiar with the game, one of its features was “advances.” Each advance brought with it certain additional capabilities and benefits. Of course, there was a requirement before one could acquire an advance, particularly a set of pre-requisites. For example, pre-requisites for the “Navigation” advance were the “Seafaring” and the “Astronomy” advances. In turn, the Seafaring advance required one to already know “Pottery” and “Map Making”.

I created an Excel worksheet that let me use Excel’s Precedent arrows to understand the optimal path to specific advances as in Figure 1. The advances are shown in red and the benefit(s) of each advance are in black, blue and green. The Excel blue arrows show the pre-requisites for the Seafaring advance.

Figure 1

While the dated worksheet may be of limited value even to Civilization enthusiasts, the technique for creating the dependency tree is unique enough to be of value to Excel consumers. What makes it of value is that the game dependencies (in the context of work this would be the dependencies in the business model) had nothing to do with what Excel considers as dependencies! Consequently, to use Excel’s Trace Precedents feature I had to somehow map the model dependency into Excel formula dependencies.

For a version in a page by itself (i.e., not in a scrollable iframe as below) visit http://www.tushar-mehta.com/publish_train/xl_vba_cases/0908%20CIV%20game%20dependency%20tree.shtml

Tushar Mehta

Excel Advanced Filter

Excel supports two different ways to filter data that are in tabular format. Autofilter is a built-in capability driven via the user interface. As sophisticated as Autofilter has become in recent versions of Excel, no pre-defined setup can possibly cater to all the different questions that the consumer may want answered. These require a custom filter and Advanced Filter provides that capability. It is a data-driven mechanism that uses Excel formulas to extract specific information from the original data. For those who may have heard of SQL but have never been motivated to learn it, you can now leverage some of the power of SQL without learning a single word of SQL!

The layout of this document is as follows: 1) Introduction to the data set used in the examples, 2) Introduction to the Advanced Filter dialog box, 3) Filter using column headers, 4) Filter using Excel formulas, 5) Extract unique data, 6) Work with dynamic source data, and 7) Create a filter in a different worksheet or workbook.

For a version in a page by itself (i.e., not in a scrollable iframe as below) visit http://www.tushar-mehta.com/publish_train/data_analysis/06.shtml

Tushar Mehta

Unicode and diacritic characters

The primary role of Excel is analysis and visualization of data, which put less emphasis on the use of special text characters. Nonetheless, there will always be some need for special characters, both Unicode characters and diacritics in Excel.

A diacritic in English is a glyph that modifies the sound of the character to which it is attached. Examples are naïve, résumé, and saké. In other fields, glyphs modify a letter to convey a specific meaning. Examples include:

· In Statistics the sample mean is denoted by x-bar (x̄) and the sample proportion by p-hat (p̂). Examples of Unicode characters are the population mean (the lowercase Greek letter mu, μ) and the population standard deviation (the lower case Greek letter sigma, σ).
· In Economics, profit is denoted by the Greek letter pi (π).
· In Mathematics, well, in Mathematics, there are a plethora of symbols including the capital sigma (Σ) for sum and ∫ for an integral.
· Currencies are denoted by symbols such as the US Dollar ($), the Euro (€), the Japanese Yen (¥), the Chinese Yuan (元), and the Indian Rupee (₹).

For a version in a page by itself (i.e., not in a scrollable iframe as below) visit http://www.tushar-mehta.com/publish_train/xl_vba_cases/0123%20Unicode%20and%20diacritics.shtml

Tushar Mehta