Table tools add-in

Based on an idea by fellow Excel MVP Frédéric le Guen I have created a new small Excel add-in which makes your life using tables in Excel slightly easier. It sports a ribbon tab which contains a drop-down containing all tables in your worksheet so you can quickly jump to them and another one which displays all columns in the current table. Both items are also available in the cell right-click menu. The former when you right-click on a cell not in a table, the latter when you click on a cell within a table.
It also has an enhanced “Insert table” dialog which enables you to enter the name of the table and has the Headings checkbox turned on by default no matter what:
Insert table dialog

Check out a slightly more elaborate description and a download link

Enjoy!

Jan Karel Pieterse

Counting Files by Date

Someone told me we are posting more frequently lately. (For non-accountants, posting means taking the entered transactions and updating other files with the information.) Ever the skeptic, I decide to see for myself. Whenever we post, we produce a pre-post report in the form of

Pre-Post_Sales_Journal_yyyymmddhhmmss.TXT

PATH is a module level constant pointing to the folder.

If this was more than a one-off program, I would have written this line in a way that you could read it. The inner Split creates an array like

[0] = Pre-Post_Sales_Journal_yyyymmddhhmmss, [1] = .TXT

and I take the first element (the zeroth index) of the array. Then I split that further

[0] = Pre-Post, [1] = Sales, [2] = Journal, [3] = yyyymmddhhmmss

and I take the fourth element (index = 3) of that array. That’s my date in string form.

I put a bunch of dates in column A of sheet1 for as far back as I wanted to go. Then I add 1 to the cell to the right of the date. It turns out we are posting more frequently.

Applications Settings v2

I made a new version of my Application Settings addin as per Sébastien’s comments in my last post.

Application Settings Version 2

As you can see, there are new settings for the following.

Application.Iteration

Application.MaxIterations

Application.MaxChange

In the case of the last 2 settings, you’ll notice that there are Set, Reset and Save buttons. This is how they work,

Set: Set to the number that is entered in the text box.

Reset: Reset to the real default or “alias” default.

Save: Save an “alias” default instead of Excel’s real default. For example, if you prefer 120 instead of 100 for Max Iterations, you can set the “alias” default so that the form does not appear when opening or saving the active workbook if Application.MaxIterations is set to 120. Also, clicking the Reset button thereafter will reset Application.MaxIterations to 120. And using the Set button to set Application.MaxIterations to any other value than 120 will show the value in red font to indicate it is not the “alias” default.

Hope this is useful. Download the new version here.

Application Settings

As posted on my blog a few days earlier,

Back in 2005, I noticed something that worried me.

You may know already that switching Application.Calculation to xlCalculationManual can make various code run faster. It can be a big time saver.

The problem, as I see it, is not switching it back to xlCalculationAutomatic. Given that some people for whatever reasons might use Manual Calculation all the time, most people don’t, especially the vast majority of average users who probably haven’t heard of this setting. With Calculation still set to Manual, they might be looking at values that haven’t be updated. Even experienced programmers might be temporarily confused until they figure out what’s going on. Imagine someone in a sales department quoting incorrect pricing to a customer or doing a faulty presentation at an important meeting. Not good.

And now for what really worries me – saving files with this setting. Let’s try something. Close all Excel files, except one to use for testing. Now switch to Manual Calculation. If you don’t know how to do it in code, you can click Calculation Options on the Formulas tab, then select Manual. Now save in that setting, close Excel, and reopen the file. If that file is the first one to be opened, Excel Calculation will be set to Manual by default, and all other files opened thereafter will be affected too. Save any of them with this setting, and the same thing will happen if they happen to be the first file opened…

So, how do you know Calculation is set to Manual without specifically checking?

You can’t. (Actually there is a way to make it more obvious. See the comment from Jake Collins)

Now, imagine sending one of these files to colleagues or customers, then realizing something is amiss days later. Again, not good. In fact, downright scary.

So, also in 2005(?), I made an addin called Calculation Checker. It checks Calculation when you save and prompts you to do so as Automatic if set as otherwise (including Automatic Except for Data Tables).

I’ve found it useful, but since then I’ve thought there’s room for improvement, so I made something new.

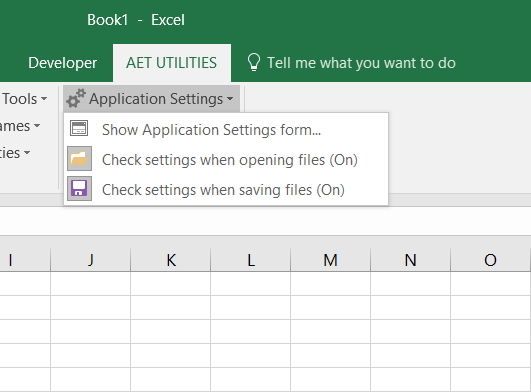
As you can see there’s 3 menu items. The bottom 2, when toggle to “On”, check files when opened/saved for the following settings.

Application.DisplayFormulaBar

Application.DisplayStatusBar

Application.Calculation

Application.ReferenceStyle

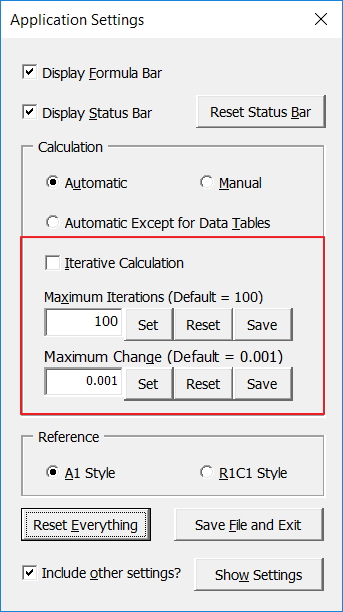
If any of those settings are not at their default, the Application Settings form will be displayed. Non-default settings are displayed in red. (Yes, the first 3 should be obvious, but easy enough to miss if you’re busy, tired or both!)

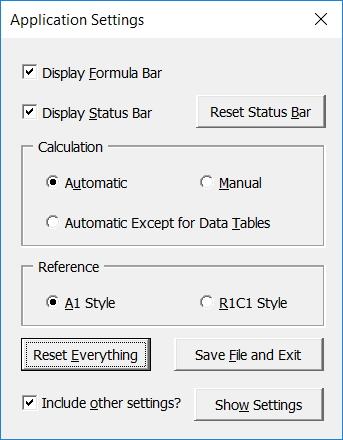
Click the form’s controls to reset them individually, or just click the Reset Everything button, then the Save File and Exit button if you choose to. Alternatively, click the X button not to save the file. Note that any other file that are open will also be saved with these settings (unless you change them later), because they are Application settings, not Workbook settings.

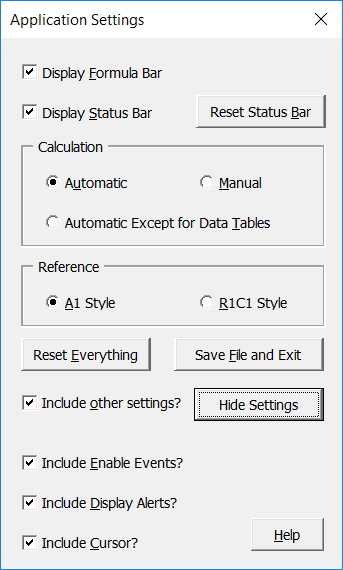
And because the form can be opened directly from the Ribbon, you can easily change any of the settings at any time for whatever reason. Click the Show Settings button and you can see other settings that can also be reset when clicking the Reset Everything button, if the Include other settings checkbox is ticked.

Note
Keep in mind that these additional settings aren’t checked automatically. The form only resets them if you click the Reset Everything button as mentioned above. Also, if Application.EnableEvents is set to False by VBA code, my addin won’t check files when opening or saving as these are the events that trigger it. In fact, you should be setting this False if any of your code does open or save workbooks to prevent my code from running, then set it back to True before the code ends.

Hopefully this tool will be of use. You can download it here.

PS. I’m going on holidays for a few days so I’ll reply to comments (if there be any!) when I get back.

Inconsistent ListRow Copy

Here’s a cautionary tale for you. Let’s say you want to let users copy rows from a Source table row by row to a Dest table, by pushing a button:

…so you whip up a bit of code like this, and assign it to that button:

And when you run it, it works just fine:

…until that is, someone hides an entire column in the source table, sets a filter that similarly hides some rows, and leaves a cell in that Table selected before running the code again, in which case you get this:

As you can see from the above:

  • For any ListRows in your source that happen to be visible, only the cells from the visible columns get copied, to a contiguous block in the Dest table, but
  • For hidden ListRows, all cells get copied

Add to this the fact that everything works just fine if the user happened to select a cell outside the table before triggering the code:

…and you’ve got the makings of a hard-to-diagnose bug that will eat up hours of your time trying to replicate.

The fix? Don’t use the .copy method. Just set the values of the second range directly to the values of the first:

…which works fine, and is faster anyhow:

In case you’re wondering what happens if you bring the whole DataBodyRange through from the Source Table using that dangerous .Copy method i.e using code like this:

…then again the results depend on whether a cell is selected in the Source table:

…or not:

Again, avoid the inconsistency by setting the values of the second range directly to the values of the first:

…which works fine, fast:

Here’s a sample file:LRCopy Test

Always Use Stored Procedures

I take data that has been entered in Excel and I store it in SQL Server. A lot. I do that a lot. The proper way to do that is to create a stored procedure for every database operation you need and to execute that stored procedure from VBA. The quick and dirty way is to build a SQL string and execute it. As you might have guessed from the title, I chose the quick and dirty way and was recently bit in the ass.

Here’s the long and the short of it: Some numbers got formatted as dates and it really screwed stuff up. I had some code that looked similar to

The field ManifestID is a BIGINT and vaData(i,1) contained 4/15/2023. The ManifestID was 45031, someone (me) mistook that for a date that lost its formatting and promptly fixed (broke) the formatting. I noticed that several dozen entries in Blend had a ManifestID of zero. SQL Server dutifully took 4/15/2023, did the division (4 divided by 15 divided by 2,023), came up with zero, and put zero in the field.

After some self-flagellation, I wondered if a stored procedure would have caught this error. I assumed that when I tried to pass a date into a BIGINT parameter, the code would error out and I would have avoided this whole mess. But I was wrong. Instead, the stored procedure converted the date to its integer value – not by dividing like in the SQL String method, but by some conversion that I didn’t think was possible. Excel stores dates as the number of days since 12/31/1899. That’s not unique, but I’m pretty sure SQL server doesn’t store them that way. And how would ADO or T-SQL know to convert it in that way?

I devised a test. First create a table

Next, create a stored procedure to insert records

Then I wrote some code to insert rows

In the code, I define two formats in an array: General and m/d/yyyy. I loop through that array and apply the formats to cell G1 where I have an unsuspecting integer. In the first pass, it’s formatted as General and looks like a proper integer. I build up a INSERT INTO Sql string and execute it right off the connection. Then, still inside the loop, I do it the right way: Create a command object, add a parameter, and execute it.

In the second iteration of the loop, cell G1 gets formatted as a date and it all happens again.

I was expecting an error, so I had an error handler that printed out the whole table whenever thing bombed. But it never bombed. It executed just fine.

With the integer formatted as a number, both the string method and the stored procedure method inserted properly. That’s the first two 45000’s. The third 45000 is the string method when the integer is formatted as a date. That’s the one where SQL does division. The last 45000 is the one I thought would error out. But passing in a date to a BIGINT parameter converted it to the proper number. I even put G1 into a variant array to simulate my real world situation.

I still don’t know, and am interested to know, what is doing the conversion. But in the meantime I’m happy to learn my lesson and vow to use stored procedures like a good boy.

Junk Chart? Cover Art!

Yes, I have all of Edward Tufte’s beautiful books, as well as quite a few from Stephen Few and others. Yes, I know that you shouldn’t embellish charts with images and unnecessary bits for the sake of it. But even so, I just love this cover from The Economist that just arrived in the mail:

It’s not a junk chart when it’s cover art.

If only someone in the PowerBI community would create a custom visual for this, and upload it to the Office store. Actually, let’s go one bigger: If only Microsoft open-sourced the Excel visualization engine like they have done with PowerBI visuals.

Don’t know what I’m talking about? Microsoft enables external developers to create their own custom visuals into Power BI, and even better, to share those visuals with the wider PowerBI community. Heck, they’ve even published the code for all their own Microsoft visualizations to GitHub, so that developers can study them, learn from them, and improve on them. Meaning developers can create new charts that Microsoft haven’t got around to making yet, haven’t thought of yet, have stuffed up, or wouldn’t bother with.

Imagine how cool life would be if we could do this too.

Cue dream sequence

Say you’ve got some internal migration data sourced from a couple of Population Census tables. And say you want to see what net inflow and outflows look like in your home town. You go look on the ribbon for some suitable geographical chart to display the data, but find the cupboard is pretty bare:

So you head over to the Office store, and see something that looks promising, put together by some generous non-Microsoft developer with far too much time on his or her hands:

You download and import the visualization template into your Excel project, see it’s icon appear in the ribbon, click it, connect the resulting chart up to your own data, and reap the insights:

Man, that kind of custom functionality would be enough to make Jon Peltier do this:

Like my dream? Vote for it at UserVoice. Your vote matters.

Look Ma…No PowerPivot!

So back in 2015 when I was trying to write a book, I took time out to rant that despite every version of Excel since 2013 having the Data Model baked in as standard, it wasn’t a heck of a lot of use to you in the event that:

  1. You wanted to mash together say a UnitPrice from one Table with a SalesQuantity from another, in order to display the derived Total Revenue in a PivotTable; and
  2. You were a tightwad that didn’t happen to have one of the premium PowerPivot SKUs installed.

Because while you could create a relationship between two Tables without PowerPivot:

…the option to create a calculated field to multiply Qty against Price was greyed out.

Disheartened with the lack of functionality in the non-Premium-Excel space (and sternly talked-to by my wife about the need to shave and go out earn a crust) I flushed the nearly-finished manuscript down the toilet in disgust. But now that I’m flush again, I’ve dusted off that manuscript (it wasn’t really down the toilet) and am updating it, so that I can nearly-finish it all over again.

Anyways, I was subsequently looking at this DataModel thing again, and rewriting the bit that said how sucky it is that you need to pay a premium in order to do a pretty standard thing, when I came across this:

Wow…It IS possible. Tight-wad analysts of the world: You too can do PowerPivoty stuff, without paying a cent more. You heard it hear first. Or second, rather.
Thanks, Mike Girvin, from the bottom of my wallet. :-)

Look Ma…no PowerPivot:

I wonder what limitations this PowerPivot back door has, if any?

—UPDATE—
I found this from Chris Webb’s blog:
PowerPivot has been integrated into Excel, kind of. This means that the xVelocity (aka Vertipaq) engine is now native to Excel, and you can do all the basic PowerPivot stuff like loading vast amounts of data from multiple data sources and querying it via PivotTables directly in Excel, without installing any extra addins. PowerPivot does still exist as an optional extra however: you need it if you want to use the more advanced functionality that exists in PowerPivot today, such as filtering data before import, using diagram view, defining hierarchies and perspectives and so on.

And further down the page there’s some great commentary between Chris and Colin Banflied, including this from Colin:

  • xVelocity is divorced from PowerPivot, and built into Excel
  • PowerPivot is now simply a UI to administer the data model.

I’d always thought that while any edition of Office 2013/2016 can interact with a PowerPivot Excel Workbook (open it, click on slicers, change the pivot table etc.), if you wanted to “author” the Model you would need the correct version of Office, which includes the Power Pivot authoring functionality i.e. the PowerPivot window, which lets you define relationships/measures etc. But to some degree it appears not. Which has got me wondering…to what extent is PowerPivot just a UI for the DataModel baked in to every model of Excel? Sure, it can help you filter data before import, but so can PowerQuery, which is free in every version of Excel 2013 or later. Meaning there’s probably nothing stopping a savvy Excel VBA developer from simply rolling their own UI to help users of any post 2010 version of Excel do 99% of what they’d likely otherwise need PowerPivot for.