Do yourself a favor: Watch this, from 28:00 minutes in, to the very end.
If my calculations are correct, when this baby hits 88 miles per hour… you’re gonna see some serious s#!t.
Do yourself a favor: Watch this, from 28:00 minutes in, to the very end.
If my calculations are correct, when this baby hits 88 miles per hour… you’re gonna see some serious s#!t.
As posted on my blog yesterday.
At a former client, I was asked to submit monthly reports that show details of work performed in 15 minute increments.
My line of thought went something like this,
“Let’s see, a monthly calendar, something like the one on my fridge door comes to mind and making one in Excel should be easy…”

One problem is space. If I do several tasks in one day, do I use tiny font to make the details fit, or do I make the calendar larger to the point that I have to scroll copiously?
Also, just how practical is that style of calendar going to be when it comes to adding up total time per task? Something along the lines of a regular timesheet would be better.
I can easily fit 32 rows on my laptop screen. That’s a good start. So here’s how to do the same thing I did, if you are interested.
Leave the first row for your headers. In cells A1 and B1, enter “Date” and “Day”, then change the orientation. Right click the cells, select Format Cells, Alignment, and change Orientation to 90 degrees.
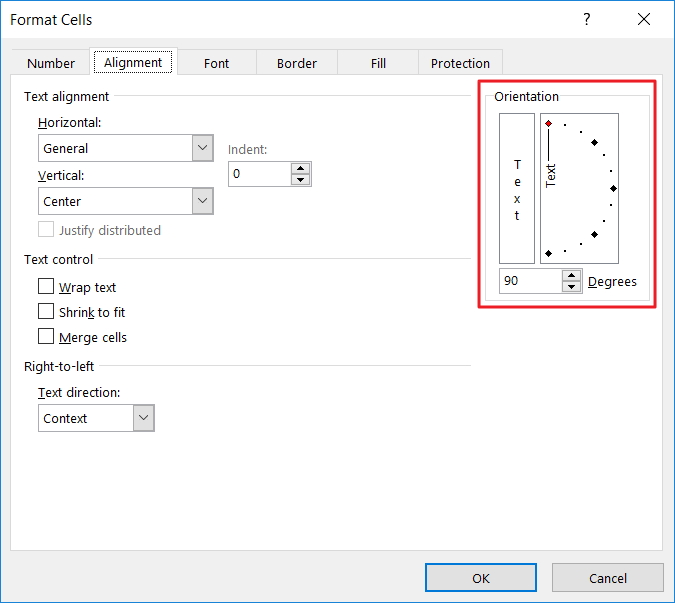
(You might want to change the Alignment too. Choose from the options on the Alignment Group on the Home Tab)
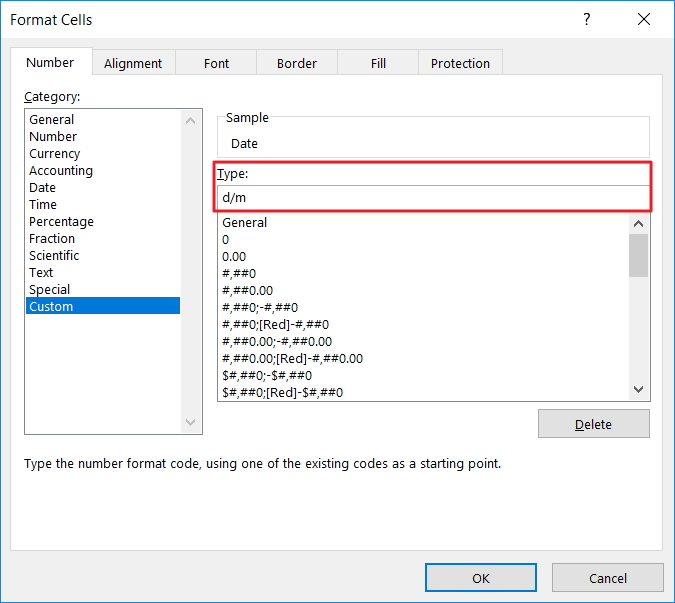
Enter the first day of the month in cell A2. Select range A2:A32, then change the format to either “d/m” or “m/d” as you prefer. Right click the cells, select Format Cells, Number, and enter the format in the Type text box in the Custom section.
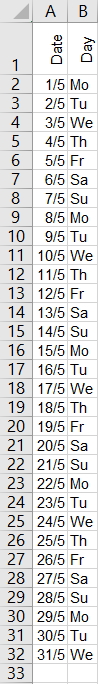
Now enter =A2+1 into Range A3:A32 and click your Ctrl and Enter keys simultaneously to enter the formula into all selected cells.
In the same way, enter =CHOOSE(WEEKDAY(A2,1),"Su","Mo","Tu","We","Th","Fr","Sa") into Range B2:B32.
Adjust the width of both of these columns and set the alignment to suit.
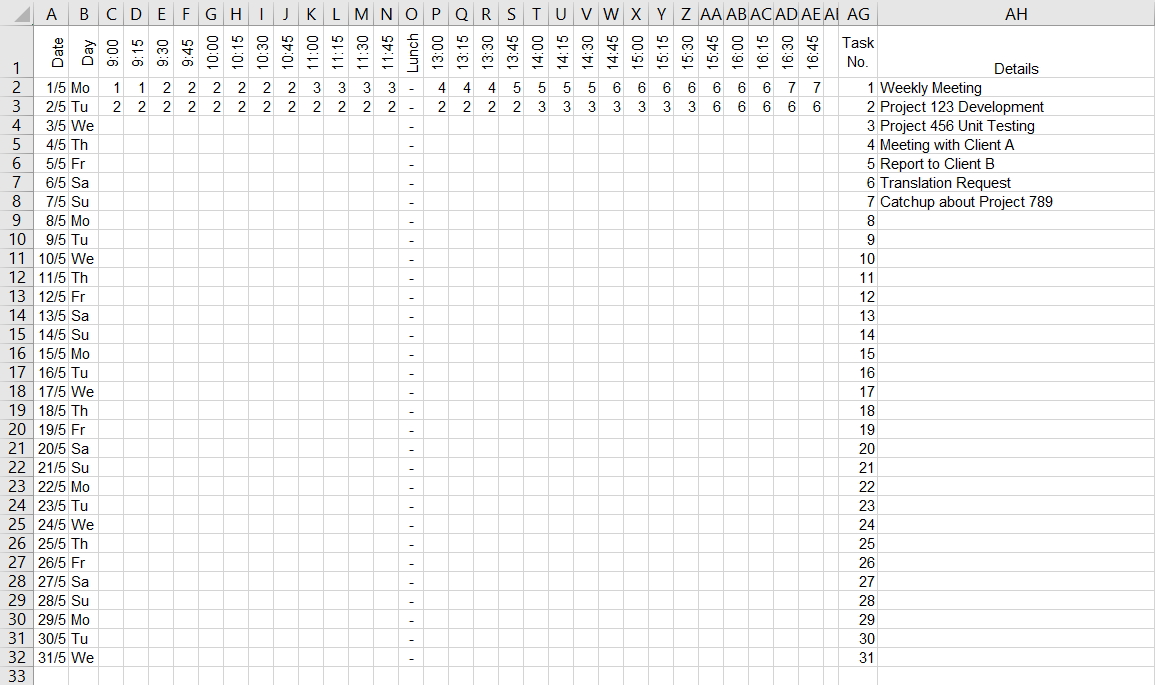
You should have something like this.
And now for the details. Long descriptions take up space, so let’s use numbers instead. Keep in mind that longer tasks won’t be completed in 15 minutes, and recurring tasks will be duplicated so that’s going to cut down the number of tasks in total. With any luck, we can keep things within double digits.
Start times allotted for the 15 minute intervals go in Row 1. Adjust the Orientation to 90 degrees. “h:mm” is a suitable format.
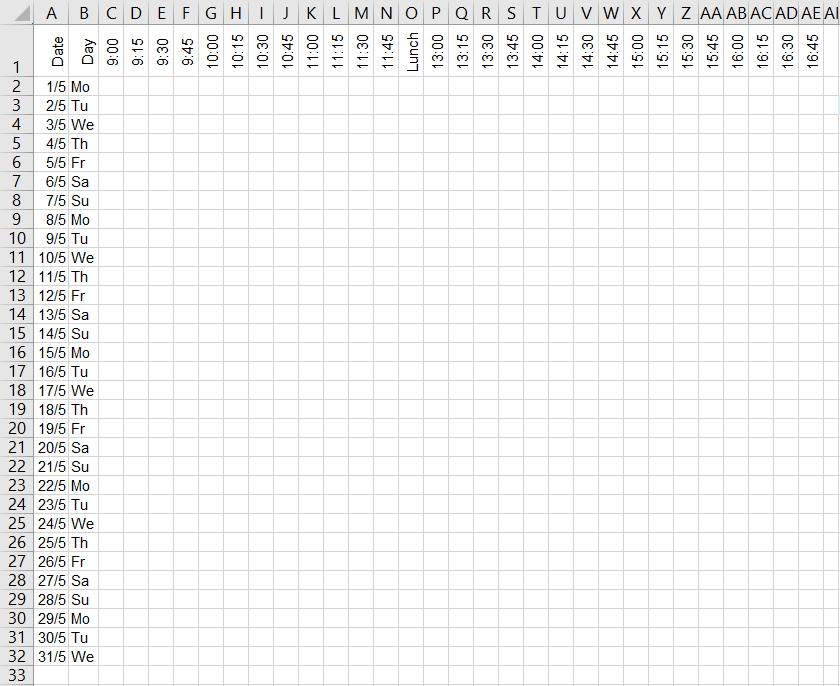
The task descriptions that match the numbers can go on the right. But note the numbers to their left to perform a lookup.
Important: adjust the following ranges to suit your requirements. Use Named Ranges if you prefer.
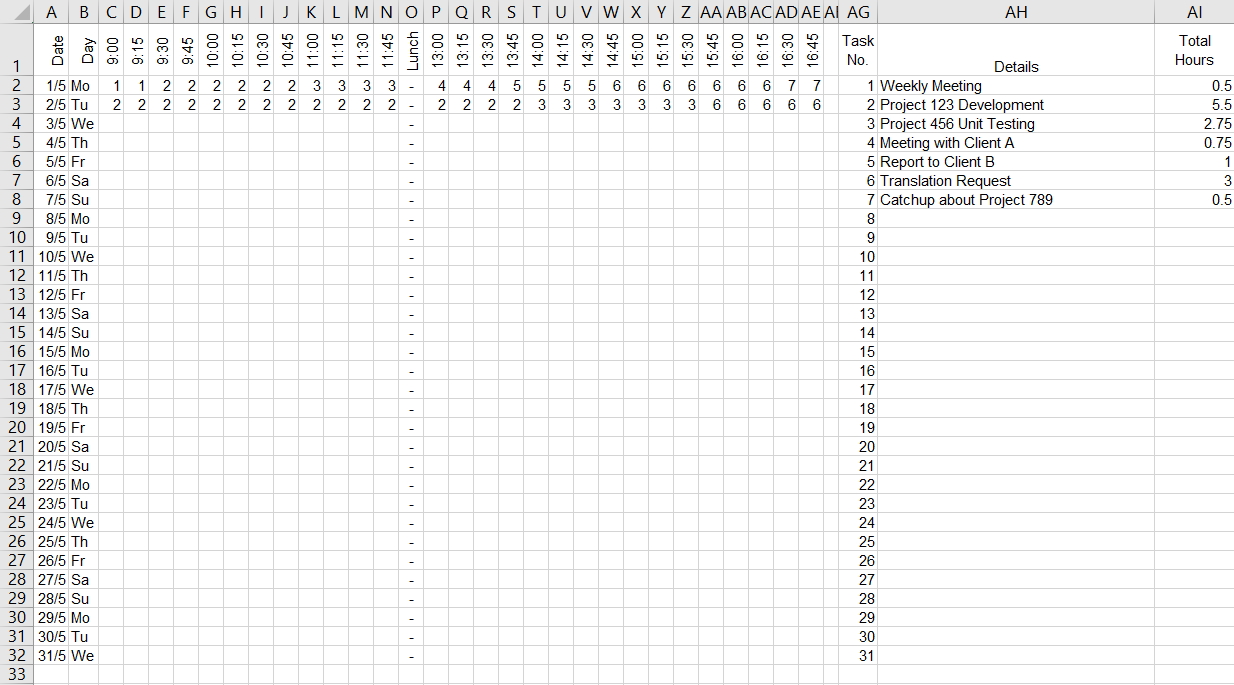
Enter formulas to add up the time. Type the following formula into Cell AI2, and drag down to the end of your list.
=IF(COUNTIF($C$2:$AE$32,AG2)=0,"",COUNTIF($C$2:$AE$32,AG2)/4)
You should have something like this.
You can freeze the first row if the number of tasks exceed the number of visible rows on your screen. (View Tab, Windows Group, Freeze Panes, Freeze Top Row)
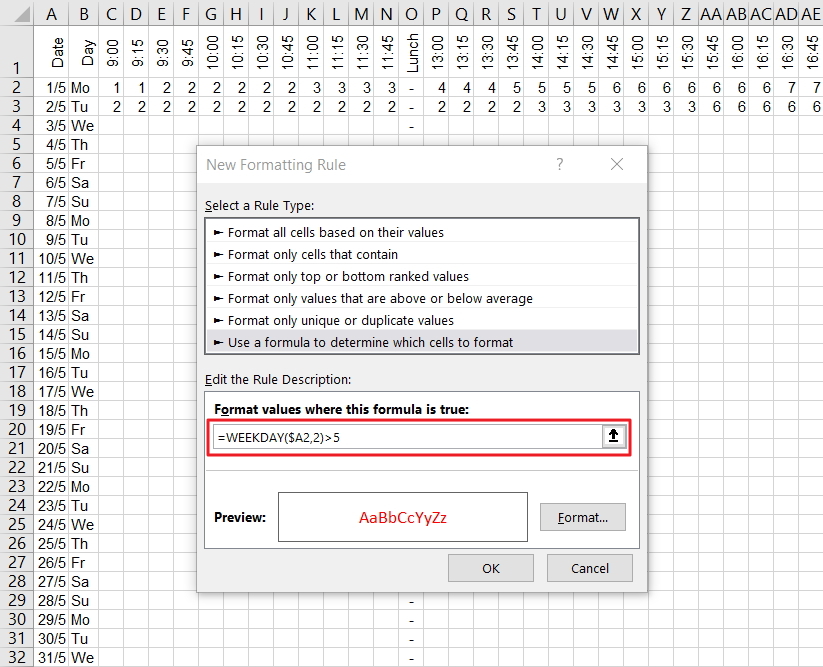
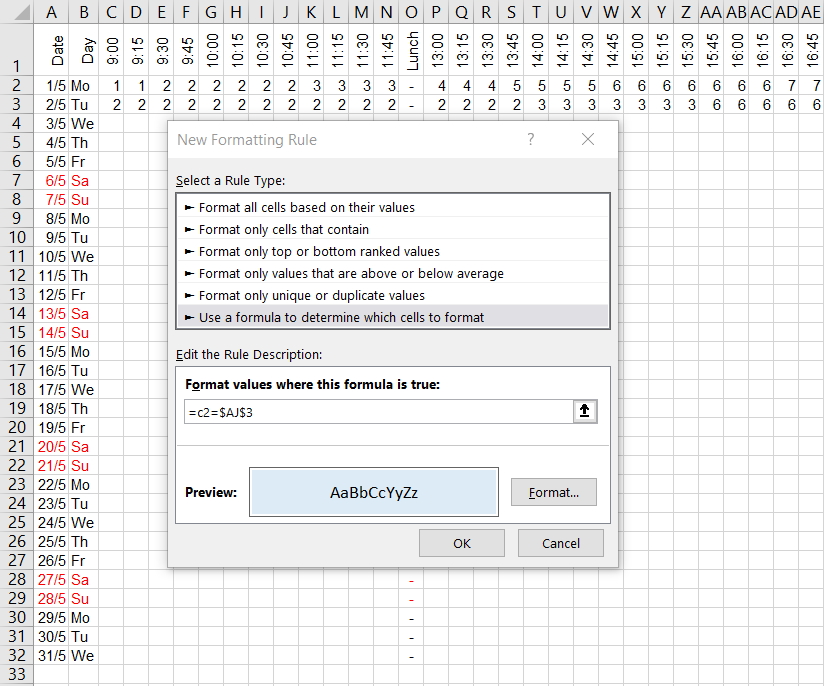
Now for some extra features to enhance visibility. Why not add some Conditional Formatting to highlight the weekends? With Range A2:AE32 selected, click the Home Tab, Styles, Conditional Formatting, New Rule, then “Use a formula to determine which cells to format” and enter this formula. (Click the Format button to choose a suitable format)
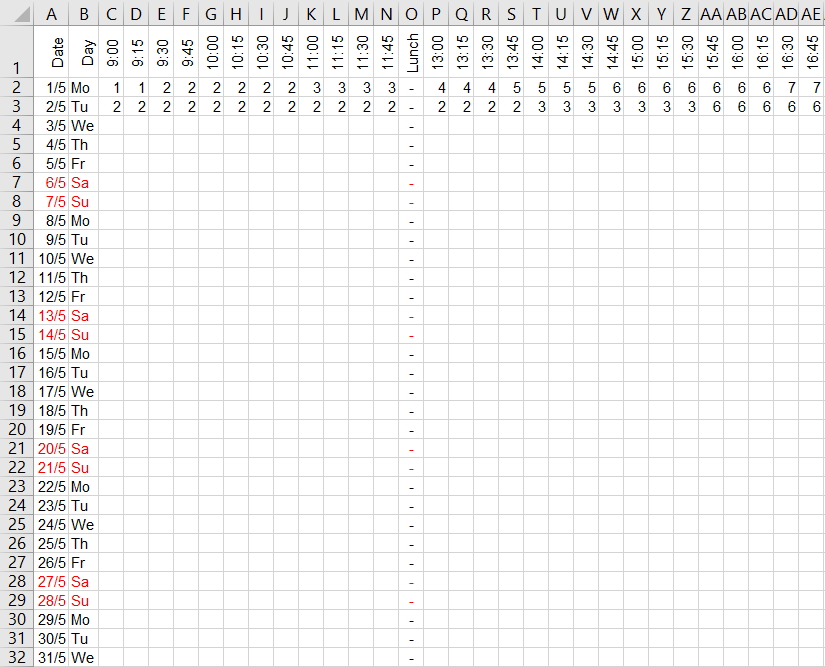
Here’s the result.
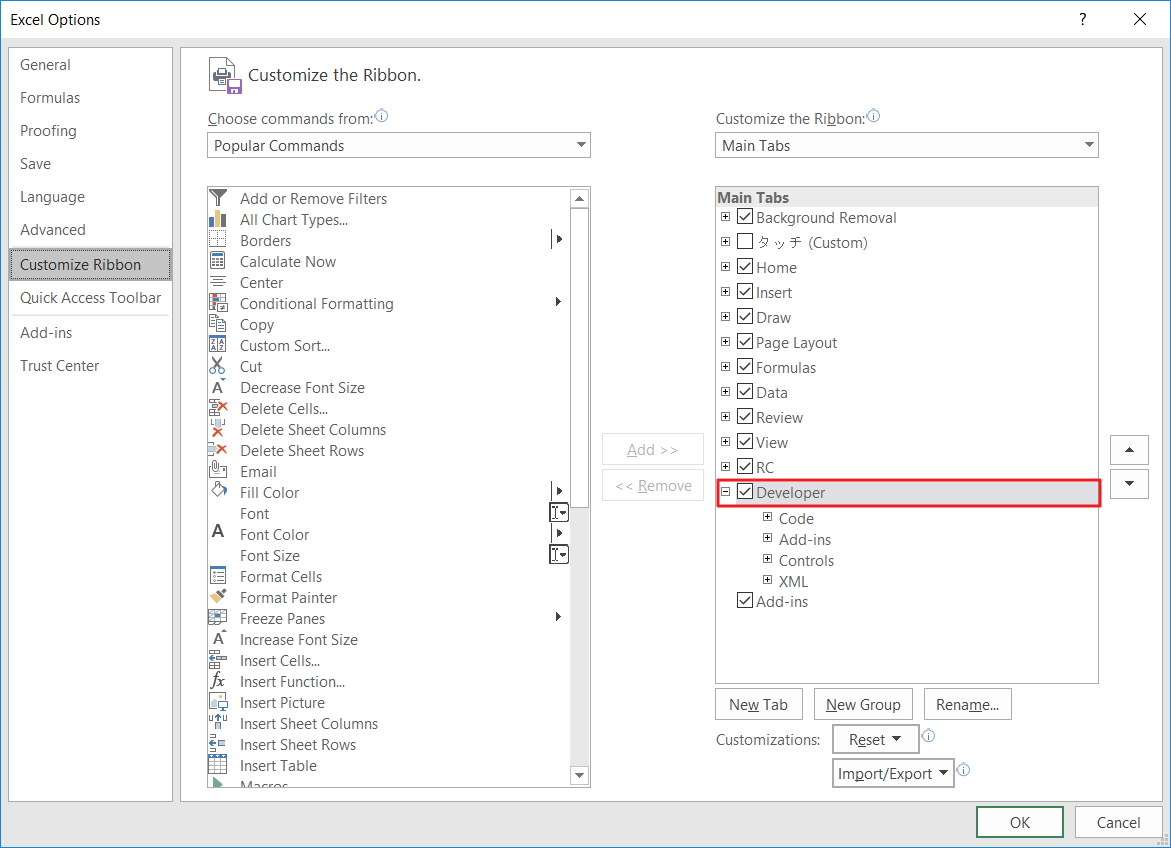
An ActiveX Combo Box and a bit more Conditional Formatting makes it easy to see when the work was done. If you can’t see the Developer Tab on the Ribbon, select the File Tab, Options, Customize Ribbon, then tick “Developer” on the list to the right and click the OK button.
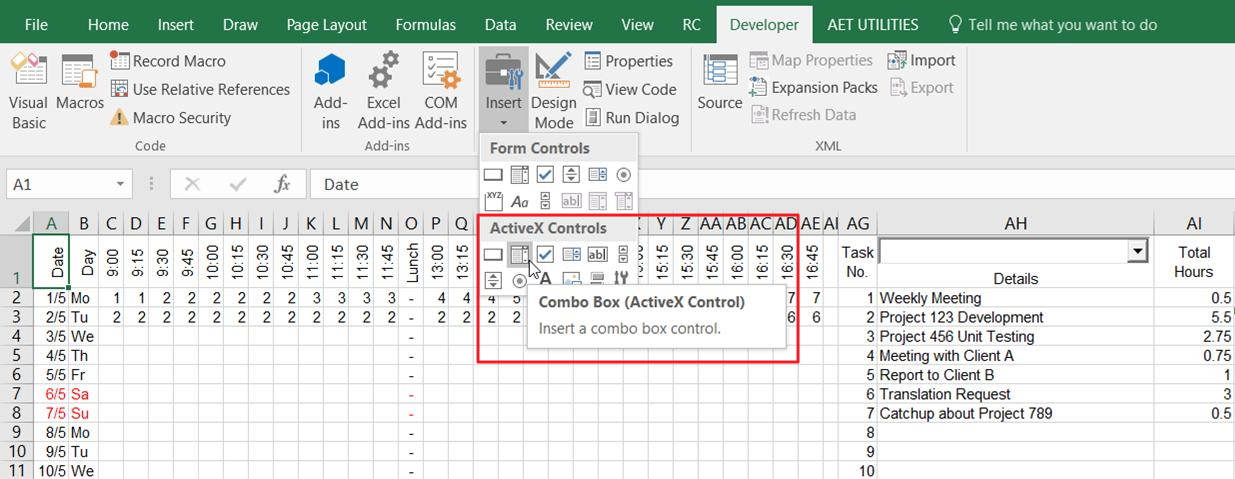
On the Developer Tab, select Insert from the Control Group to add an Active X Combo Box. (I’ve already added one to Cell AH1)
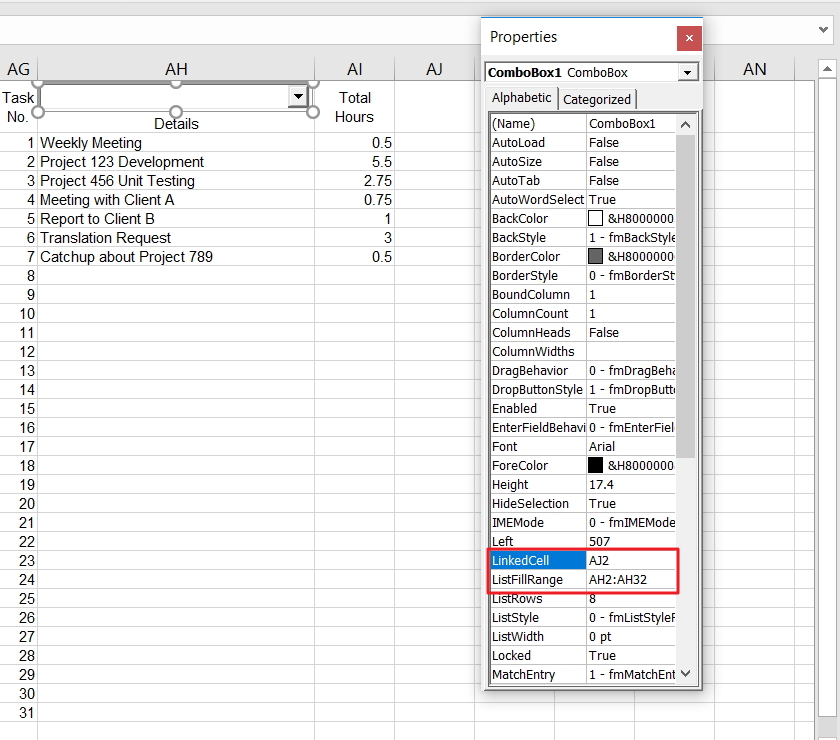
Right click the Combo Box and select Properties. Set the LinkedCell and ListFillRange properties. I’ve hard-coded my ListFillRange range reference but you can use Named Ranges too, as in “=Tasks” without the quotation marks.
When finished, toggle off Design Mode on the Developer Tab.
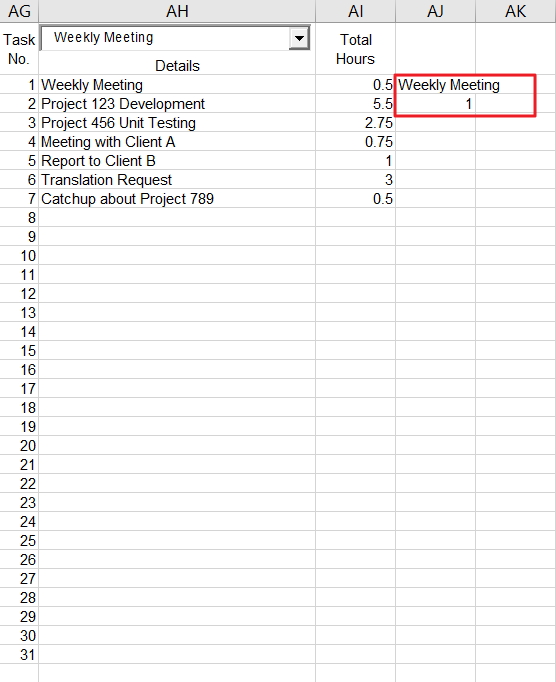
Note the linked cell. That gives me the selected item of the list. Now I use another formula to get the reference number which I have put in the cell below the linked cell (In this case, Cell AJ3).
=MATCH(AJ2,AH:AH,0)-1
If I select the first item on the Combo Box, Cell AJ3 will show 1.
Here’s the Conditional Formatting for the details part of the report. (Range C2:AI32)
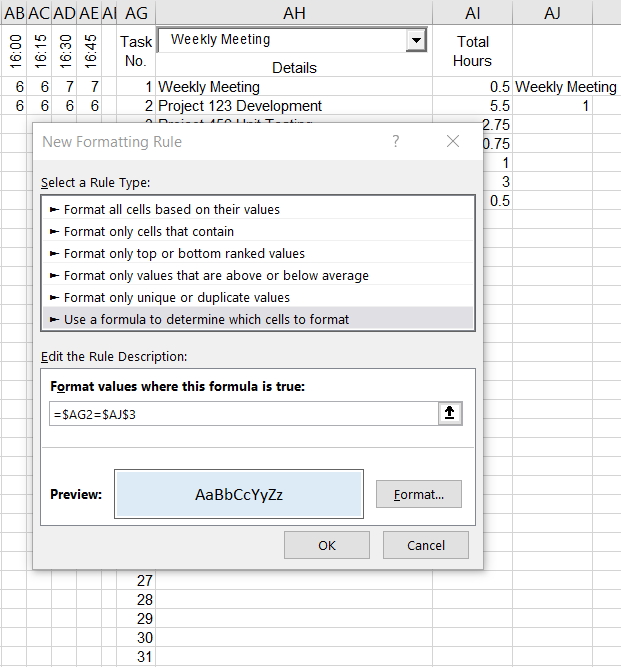
And here’s the Conditional Formatting for the list. (Range AG2:AH32)
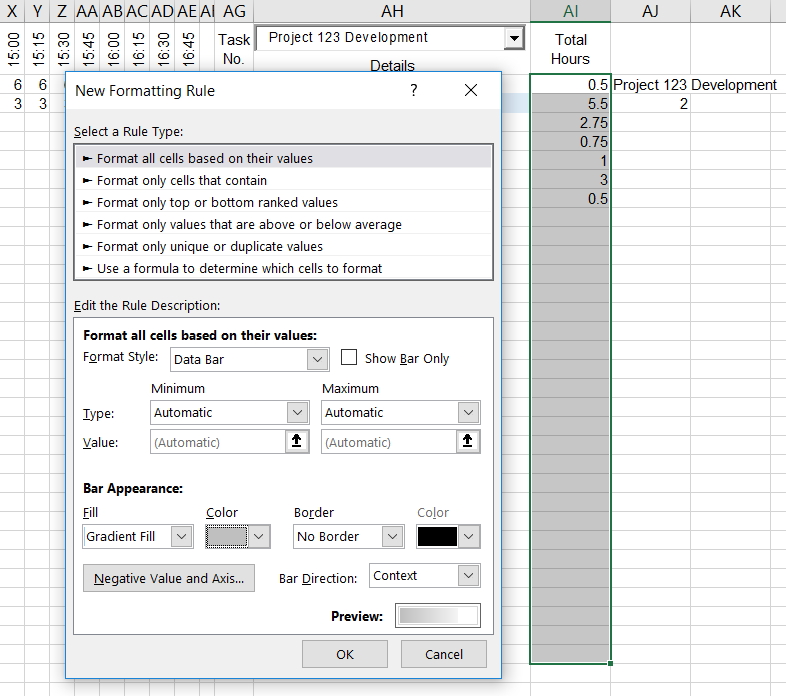
I also added some Data Bars to the hours.
And we’re done.
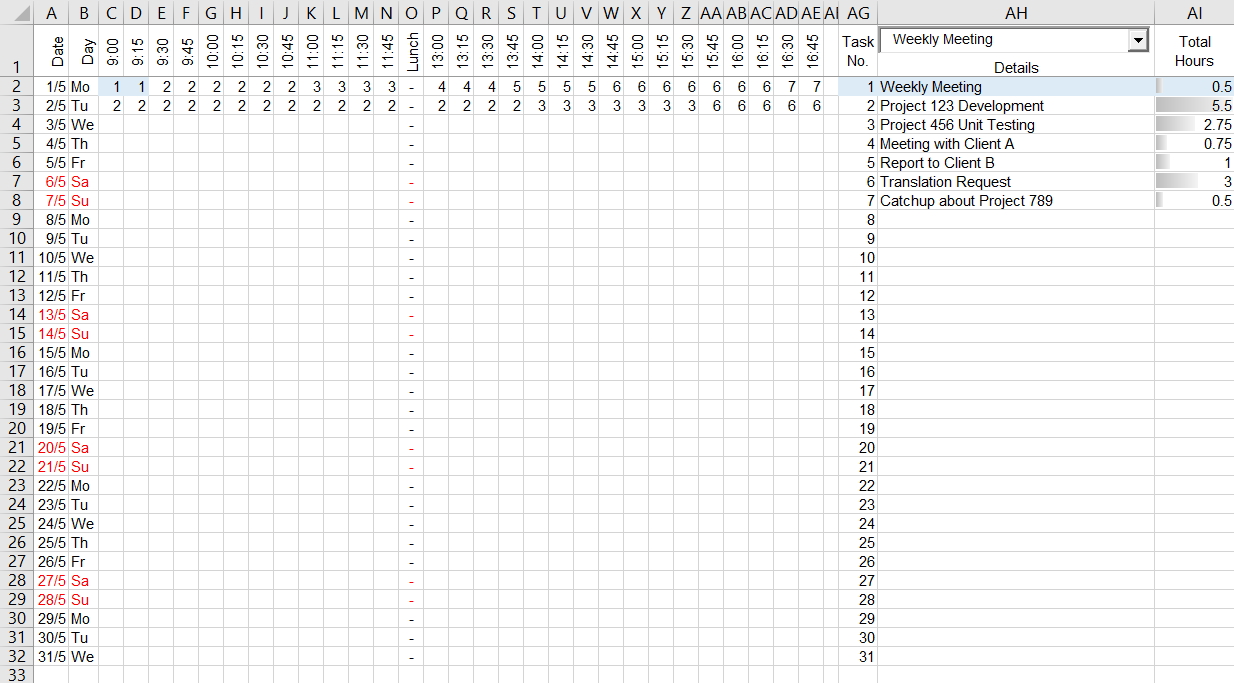
No VBA was used so you can send the file without explaining the need to enable macros.
Here’s a download link if you want to skip making one yourself.
…that is the question.
Heck, never mind PowerBI…I’ve only recently started using PowerPivot and PowerQuery. (Not because I’m a slow adopter mind, but rather because the places I’ve been working have been slow adopters.) And yet here I am considering waging war on a new front entirely. Will PowerBI let me make considerable further gains without imposing considerable future cost to my organization’s long-term budget? Or can a large part of what PowerBI offers be achieved at much lower cost using my modern version of Excel, in conjunction with models and dashboards being built by my colleagues using the SQL Server stack – technology we already own?
On that first point, I found Matt Allington’s post Which To Use – PowerBI Or Excel? immensely helpful. On that second point, being a purely Excel guy, I’ve never learned much more about SQL Server other than how to write TQSL queries to get the data I need into a PivotTable. I’ve often heard other MS SQL Server terms such as SSRS, SSAS, and SSIS bandied around by IT types, but they have never really meant anything much to me, and so have always gone over my head. I’m just an Excel guy, after all. So here I come along talking about this thing called PowerBI that can be used to easily share data and insights, and my colleague doing stuff in the SQL stack says “Hmm…sounds awfully like this SSRS/SSAS/SSIS thing that I’m using. Compared to SSRS/SSAS/SSIS, what exactly *is* PowerBI?”
Not being an expert in either product, I couldn’t answer. So I did the next best thing: got the boss to pay for getting it certified on our IT system, and then got it installed on all my unit’s PCs, so that she could find out, and then explain it to me. It took my colleague just 5 minutes to understand what PowerBI is…or in her words:
OMG. I know what this PowerBI thing is. It’s easy.
So there’s your answer: PowerBI is much easier and quicker than developing in the SQL Server stack. But of course, while you can easily develop reports using the completely free client tool (i.e. PowerBI Desktop), you’ve still got to share those reports with end users. So what does that cost? $9.99 per user per month, regardless whether that user is a Rob Collie/Matt Allington type, or the cleaner (and I’m not talking about Harvey Keitel here). Yup, everybody has to have the pro license in order to consume shared reports, regardless of whether they are star developers, or occasional peekers.
That $9.99 per user per month is incredible value if you’re providing dashboards with the kind of people like us: Folk who put the ‘intelligence’ in Business Intelligence’. But that is pretty expensive across a whole bunch of non-self-service BI types, who only want to look at things occasionally that are already filtered to show only what is relevant to them. And who perhaps only glance at a handful of reports, a handful of times per year. So it’s hard to justify an organisational roll-out at great cost of a promising new technology. Currently, I can produce and distribute on-demand static reports for these folk for free, using Excel, VBA, and Outlook. When you don’t intend to click on filters, a PDF will work just fine.
This left me puzzled as to how to justify a much easier development tool to the bean counters. Quite coincidentally, yesterday MS announced the release of their PowerBI Premium plan. I thought this might help the business case for our organisation, but unfortunately it offers even worse value for mid-sized organisations than the $9.99-per-month flat rate that I’ll already struggle to get across the line with. Under the premium plan, you still pay that the $9.99-per-month flat rate for each developer, as this gives them the pro version of PowerBI that they need to create shareable reports. But in addition you also effectively buy a lump of capacity on a reporting server (either on premise or in the cloud) big enough to handle the load from servicing the demands of the folk actually consuming these reports. But those lumps are pretty big: they come in $60,000-per-year clumps. Yikes!
You can take a look at the pricing via Microsofts online calculator here. Here’s a cut-down view of how it looks:
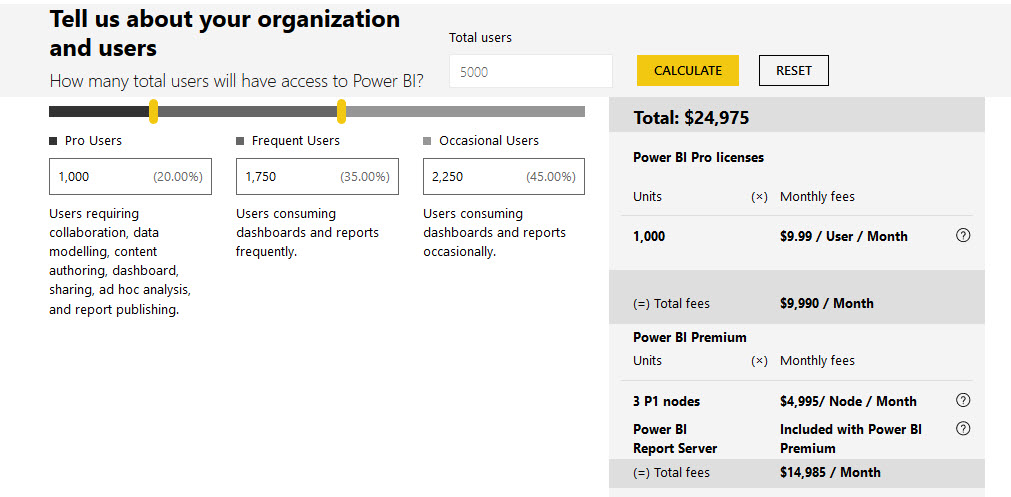
Let’s look at the default view shown in the calculator above: An organisation of 5000 users, 20% of which are pro, 35% ‘Frequent’, and the remaining 45% ‘Occasional’. MS estimate the number of nodes you’d consume given this mix is 3, at $4,995/Node/Month. When you do the math, 45% of that $25k total is due to the Pro User licesces, and the remaining 55% is effictively the cost of sharing the reports with the wider organisation.
The bottom line here is that:
I agree with Matt Allington’s excellent post-mortum of this pricing announcement that while this might offer better value for very large customers, it’s completely unaffordable for medium-sized organisations. The middle guy is left out in the cold.
So how do MS work out the number of nodes you’re likely to need, given your Total User count and the split between user types? I did a bit of reverse engineering to determine that Microsoft’s calculator is based on:
Note the disclaimer from MS below the calculator: This calculator provides a rough and conservative estimate based on simple usage logic. Actual needs to support a given workload could significantly vary based on data models, data volumes, number of queries and their complexities, refresh rates, usage distribution and pattern changes over time, and other factors. This estimate should be regarded only as guidance and is not providing any guarantee of performance.
With these node calculations in hand, I rolled my own calculator, using Excel. Try it out in the web app below. (Orange cells are input cells).
So will we proceed down the PowerBI path? Maybe. But I’m tempted to stick with my current ‘old-school’ approach of building Dashboards in Excel, and then using VBA to automatically filter them, PDF them, and email them to the cleaners. Rather than being taken to the cleaners, courtesy of Microsoft’s licensing.
You?
Next week, seven world-leading Excel MVPs – or The Seven Samurai, as I like to call them – are heading to Sydney and Auckland to show you how to slice your Excel data like never before. They’ve already massacred Melbourne. They’ll be butchering Brisbane between Wednesday 4th – Thursday 5th May. Then storming Sydney on Mon 8 – Tuesday 9 May. And then they annex Auckland later that same week, between Thursday 11 – Friday 12 May. If you want to catch them on tour, then here’s a link to all you need to know.
What’s that? Haven’t seen the movie, and want to know what you’re letting yourself in for? Well, here’s a brief plot synopsis:
The year is 2017. It is the agile period of Excel history. Our saga follows the story of a remote village of accountants who hire seven Dēta Ronin (masterless data Samurai) to combat bad practices that threaten to steal the accountant’s productivity after the next financial quarter.

Just look at them. Smiling assassins, the lot of them. God help the accountant that doesn’t do exactly what they say.
I saw a similar movie this time last year: The Dirty (Excel) Dozen. I laughed. I cried. I pivoted. I *power* pivoted. Heck, I even power-queried, power-BI’d, and power-networked. And learnt some stuff that saved me so much time back at work that now I can fill in the hours between hitting Refresh and hitting Refresh again with power-naps. I came out much better off. (And because I went last year, I also get a 30% discount this year. You can too, if you went last year).
This latest release is clearly targeted at the accountant market. Now I’m no accountant, but I’m going anyway, and perhaps you should too – regardless of whether you are an accountant or something sexier. After all, it’s not your money we’re spending here…it’s the divisional Training Budget. And we all know that if you don’t spend the Training Budget in full this year, you’ll get a smaller Training Budget to not spend next year. So you owe it to your division to spend it on something. And that something should be on Excel productivity, not some touchy-feely soft-skills finishing school crap. So literally take one for the team, and ask your boss for the readies and the release time today.
Now, if the boss is a bean-counter, you might need to put some fluff around that request. So let’s pretend we *are* accountants just for a moment, and see how the business case stacks up: We’d be getting 19 CPD hours (whatever the hell they are) just from sitting there behind our quiet accountant personas, plus we’d get to learn all sorts of accountanty stuff about Excel, PowerQuery, PowerPivot, VBA, and PowerBI from the aforementioned Samurai. Case closed.
Now snap out of it. We’re bean drinkers, you and I. Not bean counters. So we’re going for other reasons that the boss need not be burdened with. I don’t know about you, but I’m going because Auckland is 643.3 kilometres away from my day job in Wellington. Meaning I get to spend two full days NOT looking at the crappy spreadsheets I’ve spent the last few months developing. Not to mention that this 643.3 km learning mecca is in a northerly direction, away from the Antarctic ice caps and permanent hurricanes. Yup, it’s respite care, Excel conference style. Far away from the Excel hell that I find myself immersed in, today. Oh, and while I’m up there, I’ll be attending Ken Puls’ presentation on Making your data mobile with PowerBI at the Auckland PowerBI User Group. Maybe I’ll see you there, too.
You can find their bios here, if you speak fluent accountant. I’ve translated it into Jeff-Speak for the rest of us.

Liam Bastick, an experienced modeller. What kind of modelling, his bio doesn’t elaborate on. But I’m thinking underwear. Which is good, as I too like to build financial models about the apparel industry.
 Chandoo, who like many other global superstars before him only needs one name. Although I’m not sure Chandoo will actually be able to make it: His sense of direction is pretty questionable. Just look at that background…does that look like New Zealand to you? Not even close, buddy.
 Roger Govier, who no doubt will be packing his red jersey and perhaps overstaying his tourist visa in the vane hope that he’ll see some of his Welsh compatriots finally trounce the All Blacks at the upcoming Lions tour of New Zealand. (The last time being when I was born. I’m now 46. *Sniggers*)
 Ingeborg Hawighorst, who’s from New Plymouth – a province so devious and deceitful that that the whole place pretended it was Japan in The Last Samurai.
 Jon Peltier, who in this photo is saying ‘chart’ instead of ‘cheese’. (I plan to teach him how to say “Good Chart” in Maori. He loves ka pai charts)
 Ken Puls, who in this photo is saying ‘C’mon and take the damn photo already, data monkey. It’s the little button on the left. No, my left’.
 Mynda Treacy, who put the ‘dash’ in ‘dashboard’ with her one hour webinars.
I’m glad that Auckland is the last stop of their southern hemisphere tour. By then, they will have (no doubt) got their presentations down pat, (hopefully) will have their Dutch-courage-driven drinking under control, and probably abandoned attempts to peek up each other’s kimonos. But it’s not just these Samurai that I’m looking forward to heckling. There’s going to be some folk from the Microsoft Mothership there as well. Here they are, consuming some ‘old-school’ data, the Excel 2003 way:

You going? Give me a shout out in the comments, and we’ll CONCATENATE. You thinking of going, but haven’t quite committed? Shout out below anyway, and perhaps one of the Samurai will drop by and talk you around. Probably at knifepoint.
I recently saw a resume with a bunch of VBA and SQL skills on it. I’ve never seen anything like it. I gave up trying to find someone with the right combination of skills a long time ago. Someone to whom I could offload some of my projects. But this had promise.
I couldn’t get a great read on his skills just from the interview, so I, with the help of a really smart coworker, devised a test. We set up a PC, gave him some files, gave him internet access, and watched to see if he could complete the tasks. We’ve never devised a test before, so I had some doubt about whether we did as good a job as we thought. That’s where you come in. If you have Excel, VBA, and SQL skills, I’d like to know how easy or hard you find these questions.
Some of the necessary files are provided below. If you don’t have SQL Server and Adventure works, you can just describe how you would do it using your database of choice. Note that we installed SQL Server Express and Adventureworks on the test PC, so he had all the tools necessary to complete the tasks.
Leave your answers to these questions, your thoughts about these questions, or both in the comments.
Here’s a sample of the results.
| Salesperson | Total Due | Total Quantity | Unique Products |
|---|---|---|---|
| David Campbell | $44,214,217.28 | 2,313 | 126 |
| Pamela Ansman-Wolfe | $46,015,977.48 | 2,622 | 128 |
Here is the schema needed to get this information
I expected this would take 30-60 minutes. So what do you think? Too easy? Too hard? Just right?
It’s a kind of a big file, but…
![]() You can download SkillTestData.zip
You can download SkillTestData.zip
The difference between numbers and text is a concept that most Excel beginners don’t grasp. It’s not very intuitive. But to work with computers, you must think like a computer. To a computer, numbers are numbers and strings are strings regardless of what they look like.
How about an example. Let’s say you’re preparing data to fill out a form. Oh, I don’t know, just some random form like a Utah Excise Tax Return. You might have data that looks like this:
Experienced Excel users will immediately notice that the 7s are right justified, indicating they are numbers, and the 1F-D is left justified, indicating it’s a string. Everything in the Schedule column should be a string. The key test is: Do I perform mathematical operations on it. If so, it should be a number. If not, then it’s simply a label whose characters happen to be digits instead of letters.
Under most circumstances, this doesn’t really matter. Of course there’s no way I could stand to see two types of data in the same column, but normal people would have no problem with it. And the few that would have a problem would just change the alignment without changing the data type. There are, however, at least two situations where it can cause problems: long numbers and leading zeros. If you enter a 16-digit credit card number into Excel, it will truncate the last digit because Excel can only handle 15 digits of precision. If you enter a number like 04712495135 into a cell, the first zero will be gone as soon as you press enter.
The first thing you should do is to format your Table columns with the proper number format. That is, any columns that should be text should be formatted as text so the new entries are automatically considered text. It’s easy enough to do after the fact. And honestly I’m usually creating a table from data that already exists, so I can’t format a ListColumn before it exists. When you already have numbers in a text column, you need to do one extra step before you format (or after, it doesn’t matter the order).
Select the column and choose Text to Columns from the Data tab.
Choose delimited and click Next. Choose a delimiter that doesn’t exist anywhere in the data. I usually keep Tab checked for two reasons: 1) It’s pretty rare to have tabs in a cell and 2) Tab is the default and I’m speeding through this process pretty quickly (Alt+A, E, Alt+N, Alt+N, Alt+T, Alt+F).
Finally, tell the wizard that the column is Text and click Finish.
If you did it right (and haven’t changed your Excel options to hide certain errors), you’ll see some green triangles next to the “numbers” indicating that Excel is warning you that you have text that looks suspiciously like numbers.
I’ve been working on an excise tax project lately that requires me to use other peoples workbooks and a lot of exported data. I run these steps several times a day so I decided it was time to automate it.
|
1 2 3 4 5 6 7 8 9 10 11 12 13 14 15 16 17 18 |
Public Sub ConvertColumnToText() Dim lo As ListObject Dim lc As ListColumn gclsAppEvents.AddLog "^+%t", "ConvertColumnToText" Set lo = ActiveCell.ListObject If Not lo Is Nothing Then Set lc = lo.ListColumns(ActiveCell.Column - lo.ListColumns(1).Range.Column + 1) With lc .DataBodyRange.TextToColumns .DataBodyRange, xlDelimited, xlTextQualifierDoubleQuote, False, False, , , , , , Array(1, 2) .DataBodyRange.NumberFormat = "@" End With End If End Sub |
I use a product called SQL Prompt from Redgate in SSMS. Honestly I can’t image life without it. They added a new feature to the grid right-click menu called Open in Excel.
It’s very handy and definitely worth the trip over to my mouse. My only complaint about it is that it adds the resulting workbook to the MRU. That muddies up my KwikOpen Addin (original, update) particularly when I’m searching for “exported” or “results”.
I don’t think they should be adding that to the MRU and I’ve told them so. But in the meantime I’m going to exclude it from my list of files. Here’s the relevant part of the Fill method in the CRcntFiles class.
|
1 2 3 4 5 6 7 |
For Each rf In Application.RecentFiles If Not rf.Path Like "*\Local\Temp\*Exported results *.xlsx" Then Set clsRcntFile = New CRcntFile clsRcntFile.FullName = rf.Path Me.Add clsRcntFile End If Next rf |
I really need to build an exclusions interface where I can enter matching strings to exclude rather than putting it in the code. Someday.
They are finally ready!
This verson includes 3 additional tools, and another option to the existing Cleanup Project Code tool.
Here’s a description of what’s new.
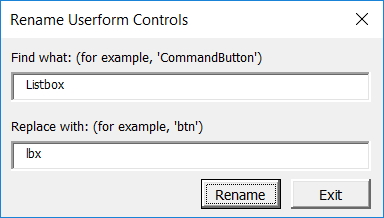
1. Rename Userform Controls
This tool allows you to batch rename all controls on a userform via a simple Find and Replace interface. In addition to changing the control names, it also changes code with the old control name to the new control name.
So, if you want to change all controls that start with “CommandButton” to “btn” or “cb”, etc, this is the way to do it all at the same time!
2. Make Project Variables List
The bigger the project, the more complex it becomes.
This tool analyses your code and makes a list of variables and constants.
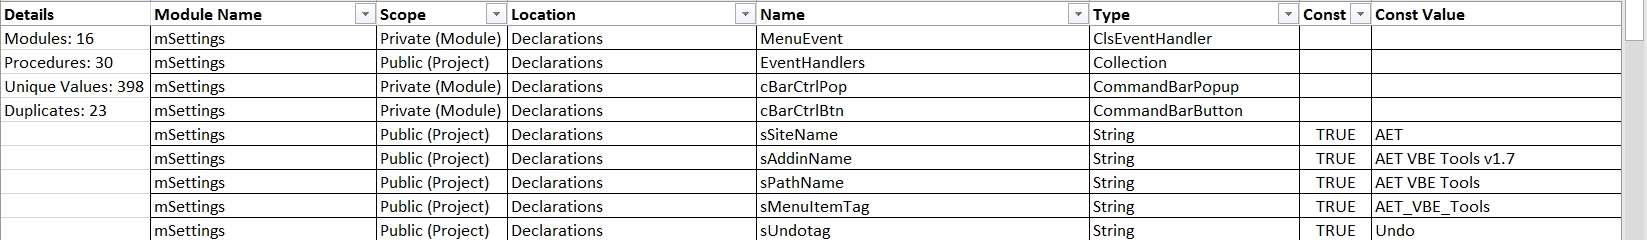
Details include:
More features are planned in the near future.
3. Copy Code for Web
If you need to show your code on the web, normal indenting won’t show. The way to get around it is to convert indent spaces to “ ”.
This tool does that and copies the code to the clipboard so you can paste it where required.
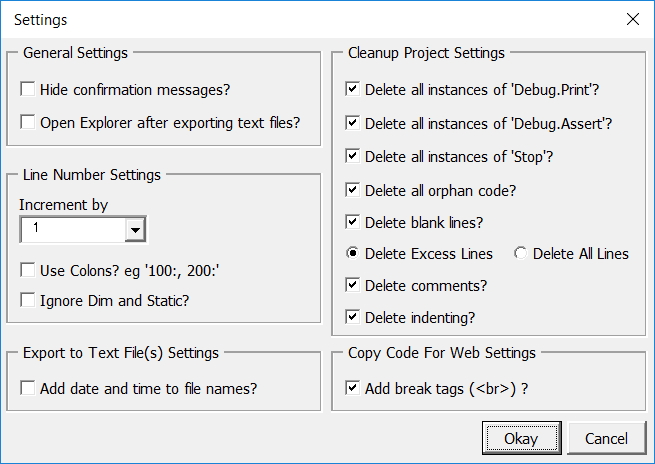
4. Delete Orphan Code
This feature was added at the request of Kellsens Willamos, who has supported me and the development of these tools from the beginning.
What’s “orphan code”?
When developing, did you ever click userform controls by mistake? Maybe you get something like this.
Private Sub lblSelectProject_Click()
End Sub
Chances are you don’t want the code, and if there’s nothing between the first and last line, it’s a fair bet that you don’t. The Delete Orphan Code tool looks for code like this and gets rid of it.
I’ve added it as an option on Cleanup Project Code. To include it, tick the checkbox on the Settings form.
As mentioned previously, I’ve made AET VBE Tools shareware. But when you see the price, I hope you will agree they are well worth the cost. (And you will get future versions free of charge!)
You can download them here.
P.S. I’m looking for affiliates and translators. If interested, email me at aengwirda at gmail dot com.