Yes, I have all of Edward Tufte’s beautiful books, as well as quite a few from Stephen Few and others. Yes, I know that you shouldn’t embellish charts with images and unnecessary bits for the sake of it. But even so, I just love this cover from The Economist that just arrived in the mail:

It’s not a junk chart when it’s cover art.
If only someone in the PowerBI community would create a custom visual for this, and upload it to the Office store. Actually, let’s go one bigger: If only Microsoft open-sourced the Excel visualization engine like they have done with PowerBI visuals.
Don’t know what I’m talking about? Microsoft enables external developers to create their own custom visuals into Power BI, and even better, to share those visuals with the wider PowerBI community. Heck, they’ve even published the code for all their own Microsoft visualizations to GitHub, so that developers can study them, learn from them, and improve on them. Meaning developers can create new charts that Microsoft haven’t got around to making yet, haven’t thought of yet, have stuffed up, or wouldn’t bother with.
Imagine how cool life would be if we could do this too.
Cue dream sequence
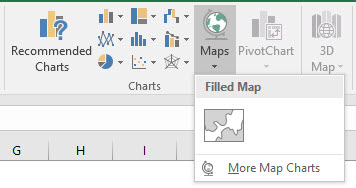
Say you’ve got some internal migration data sourced from a couple of Population Census tables. And say you want to see what net inflow and outflows look like in your home town. You go look on the ribbon for some suitable geographical chart to display the data, but find the cupboard is pretty bare:
So you head over to the Office store, and see something that looks promising, put together by some generous non-Microsoft developer with far too much time on his or her hands:

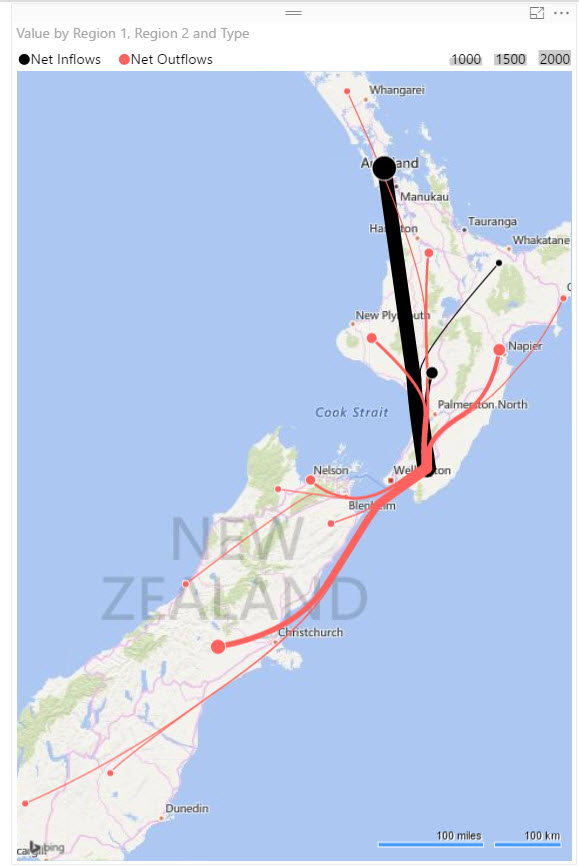
You download and import the visualization template into your Excel project, see it’s icon appear in the ribbon, click it, connect the resulting chart up to your own data, and reap the insights:
Man, that kind of custom functionality would be enough to make Jon Peltier do this:

Like my dream? Vote for it at UserVoice. Your vote matters.
How does the Economist create their graphs? They are beautiful and I wonder every time I read an article.
OMG! Microsoft actually did this. https://powerbi.microsoft.com/en-us/blog/excel-announces-new-data-visualization-capabilities-with-power-bi-custom-visuals/