Formula Auditing by RefTreeAnalyser: Objects included

Hi all,

I’ve been working on my RefTreeAnalyser again. What I’ve been up to this time is building tools which help with the analysis of dependencies which are mostly hidden from view:

  • Charts (series formula)
  • Pivot table (source data)
  • Data Validation formulas
  • Conditional Formatting formulas
  • Form controls (linked cell, listfillrange)
  • ActiveX controls (linked cell, listfillrange)
  • Picture objects (linked cell)

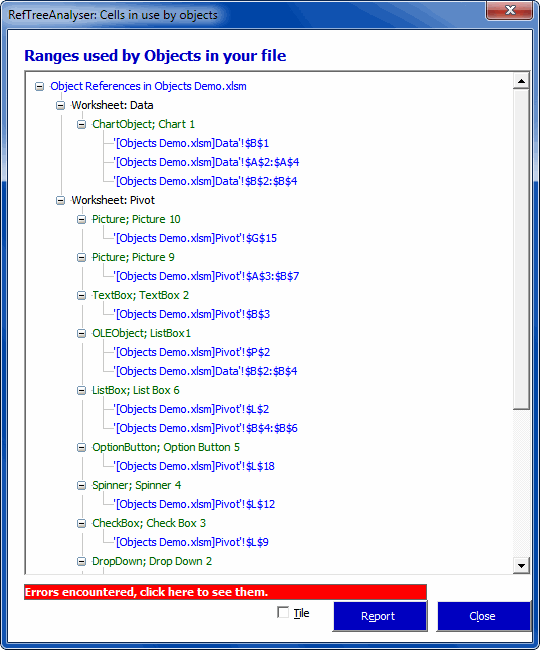
A new dialog has been added that shows all sources of the objects in your file:

Objects analysed for cell dependencies

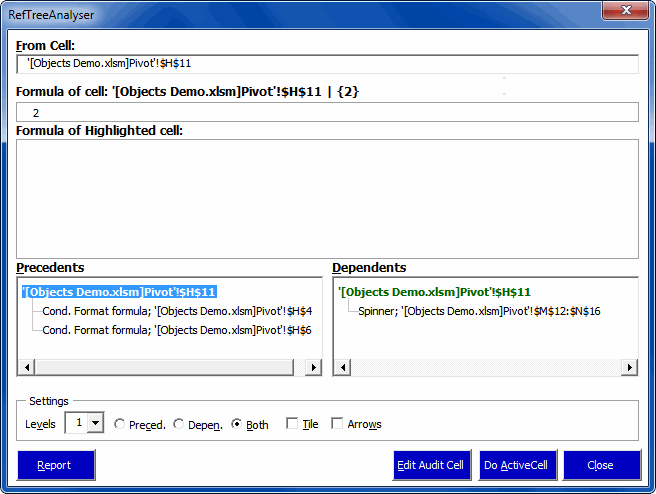
Moreover, when you analyse a particular cell for its dependencies, objects are taken into account too (well, to be perfectly honest, only if you purchase a license):

RTAObjectsInRefs

If you haven’t already done so, why don’t you head over to my website and download the tool. The demo is free and (almost!) fully functional.

Regards,

Jan Karel Pieterse
www.jkp-ads.com

Summing Times with a Floor

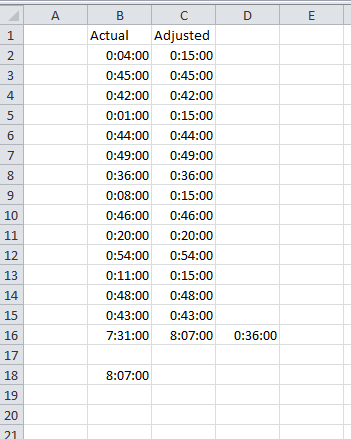
I have a list of times. Some of those times are less than 15 minutes and some are more. My billing floor is 15 minutes. That means that if a task takes me 4 minutes, I still bill 15.

In column C, I have this simple formula:

=MAX(TIME(0,15,0),B2)

That gives me the amount to bill; either 15 minutes or the actual time, whichever is greater. When I sum up that helper column, I get a total that’s 36 minutes more than the actual time. The challenge is to get rid of the helper column. And here’s the answer:

=SUM(B2:B15)+SUMPRODUCT((TIME(0,15,0)-B2:B15>0)*(TIME(0,15,0)-B2:B15))

The SUM simply sums the times and returns 7:31. The SUMPRODUCT section adds up the difference between 15 minutes and the actual time for all those times that are less than 15 minutes. If I use the Ctrl+= to calculate part of the formula, I get

=SUM(B2:B15)+SUMPRODUCT(({TRUE;FALSE;FALSE;TRUE;FALSE;FALSE;FALSE;TRUE;FALSE;FALSE;FALSE;TRUE;FALSE;FALSE})*({0.00763888888888889;-0.0208333333333333;-0.01875;0.00972222222222222;-0.0201388888888889;-0.0236111111111111;-0.0145833333333333;0.00486111111111111;-0.0215277777777778;-0.00347222222222222;-0.0270833333333333;0.00277777777777778;-0.0229166666666667;-0.0194444444444444}))

Yikes, that’s a long one. The first array is a TRUE if the value is less than 15 minutes and a FALSE if not. The second array is the actual difference between the time and 15 minutes. Recall that when TRUE and FALSE are forced to be a number (in this case, we force them to be a number by multiplying them), TRUE becomes 1 and FALSE becomes 0. When the two arrays are multiplied together

=SUM(B2:B15)+SUMPRODUCT({0.00763888888888889;0;0;0.00972222222222222;0;0;0;0.00486111111111111;0;0;0;0.00277777777777778;0;0})

Every value that was greater than zero gets multiplied by a 1, thereby returning itself. Every value that was less than zero gets multiplied by a 0, thereby returning zero. When you sum them all up, you get

=SUM(B2:B15)+0.025

And of course everyone knows that 2.5% of a day is the same as 36 minutes right? One of the bad things about using dates and times in the formula bar is that it converts them all to decimals. But .025 x 24 hours in a day x 60 minutes in an hour does equal 36 minutes. That gets added to the SUM of the actuals and Bob’s your uncle.

Is Patience a Virtue?

If you follow Nebraska football (and let’s be honest, who doesn’t?), then you know that Bo Pelini has been on and off the proverbial hot seat all year. Not surprisingly, Nebraska fans can’t see past the most recent game, so the seat gets hot after a loss and all is well after a win. I have been solidly in the pro-Bo camp. Not because I think he’s a great guy. He’s not. But we picked a horse and we need to stick with it to the end. You can’t go through all the hard times and then kick the guy out. That’s just stupid. We’ve been through six years of Pelini maturing as a coach, so let’s reap some of the benefits.

Then Iowa happened. There’s no shame in losing to Iowa; they’re a fundamentally solid team that makes very few mistakes. Nor is it “the way we lost” as has been said about Wisconsin and Georgia last year – horrifically embarrassing blowouts. What was noteworthy about yesterday was the way Pelini coached. A flea-flicker on the first play from scrimmage? A fake punt from deep in his own territory? It didn’t come off to me as a man trying to get that ninth win and keep his job. No, it seemed more like a man who already knew his fate and didn’t care about winning or losing. Following that was the post-game presser. Pelini said “chicken shit” on live TV, called out the referees (generally a no-no), and blamed the media for hurting the program. He came off like a colossal douche.

After all that, I still think we should keep him. I think he will be fired, I just don’t think he should be fired. (I have a different opinion about Offensive Coordinator Tim Beck, which you know if you’ve been within 100 yards of my house on game day.) For all the things I like about Bo Pelini, all I really want are national championships. Hell, I’d let Steve Spurrier coach here if he delivered that.

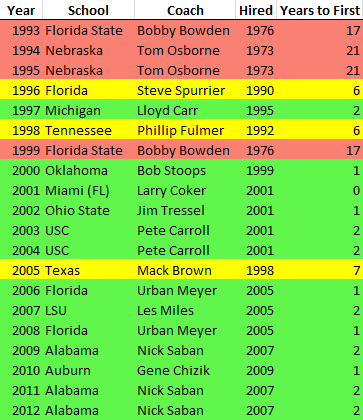
So the question becomes: Does firing Pelini get us closer or further away from a national championship? Yesterday DA and I did some back of the envelope analysis that I wanted to formalize today. Our hypothesis was that national championship coaches are hired, not built. Based on the last 20 AP national championships:

The green lines are coaches that won their first national championship within their first five years. Yellow is six to ten years. Red lines require patience. That makes a pretty good case for keeping the coaching carousel churning. That’s a lot of coaches winning national championships with athletes they didn’t necessarily recruit.

Conclusion: Hire a good recruiter, fire him after four years, then hire a good tactician. Or just hire Nick Saban – that works too.

On to some Excel stuff. The formula in E2 is {=MIN(IF($C$2:$C$21=C2,$A$2:$A$21,""))-D2}. It’s an array formula that finds the earliest year that coach won a national championship and subtracts the year he was hired.

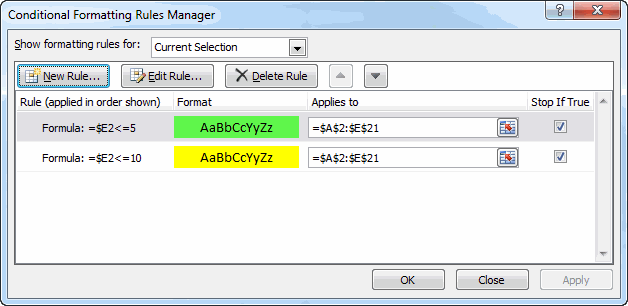
I wanted to use the fancy built-in conditional formatting to color the lines, but I couldn’t figure it out. There is a color scales option, but apparently it only applies to the cell and I couldn’t base the whole row’s color on column E. I had to roll my own color scales.

I changed the fill color of the whole range to red. That’s my default formatting. Now I can use conditional formatting to override that as the data warrants.

The “Stop if True” is important here so that future conditions aren’t evaluated.

Improving the Trace Precedents Experience

Hi all,

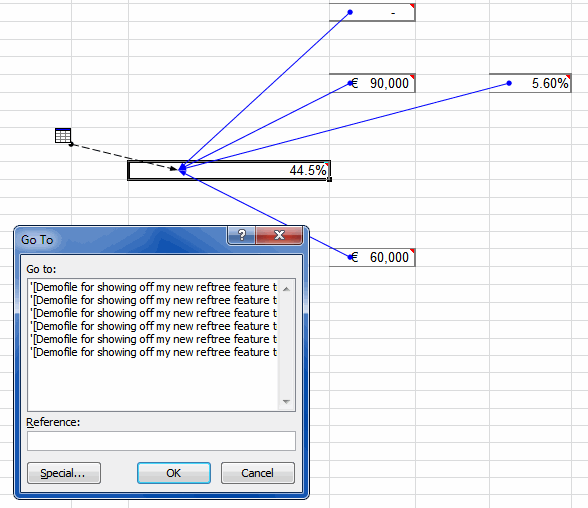
I’ve been working on my RefTreeAnalyser in the past weeks. One thing I’ve been working on is improving the not-so-intuitive way Excel displays Precedents using arrows, especially if a cell has mutliple off-sheet precedents:

Excel's way to show precedents

Notice that silly goto dialog (which you get when you double-click the off-sheet arrow with the tiny “table” icon next to it)?
Prize question: which worksheets and ranges are the entries in the Goto listbox pointing to?

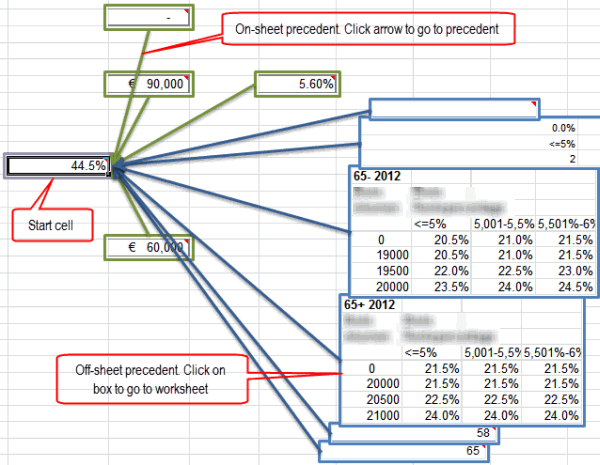
I redesigned that “experience” to this (I manually added the red call-outs to this screenshot to explain what is what):

My way to show Precedents

Note how off-sheet precedents are represented by a picture of (part of) the range in question. A nice way to enable you to see what the precedent values are.

The boxes contain a hyperlink to that range so a simple click takes you there for further inspection. On hover with your mouse you’ll get the precedent’s source address in a tooltip.

If you like this idea, why not head over to my site and download the demo version so you can try it and shoot some comments at me?

There is one snag: the new feature only works for Excel 2007 and up.

Regards,

Jan Karel Pieterse
www.jkp-ads.com

Naming Table Columns

I was reading Contextures post about duplicate entries. In it, she creates a named range that refers to a Table column. That named range will expand and contract as the Table does.

Tables have their own built-in names and they are so handy that I find myself using Tables whenever possible. Here’s me using the table name and an open bracket to get a list of columns while entering a formula.

You may have guessed that I prefix all of my Tables with “tbl”. I also use the singular noun, so it’s tblCustomer and not tblCustomers. One of my favorite uses of Table references is using them in VLOOKUPS. The third argument to VLOOKUP is the column from which to pull. I’ve never been a fan of making that dynamic. Instead, I would hard code the number and change it if the columns change. But with Table references, I find myself making that argument dynamic. It’s a little less error prone, a lot more self-documenting, and while it’s more typing, I don’t have to count columns. An old VLOOKUP of mine might look like

=VLOOKUP(G1133,$A$1:$J$331,2,FALSE)

And now it looks like this

=VLOOKUP(G1133,tblCustomer,MATCH("Carrier",tblCustomer[#Headers],FALSE),FALSE)

Instead of hard coding “2” for the column, I’m hard coding “Carrier”, which is the column name. Obviously that could change, but it will give me an #N/A! rather than pulling wrong information.

The autocomplete feature of the table references makes this easy to enter. I can type “tbl” and get a list of all the tables in my workbook.

Then I can hit the tab key to finish the job. Next, the open bracket gives me all the elements in the table, including #Headers.

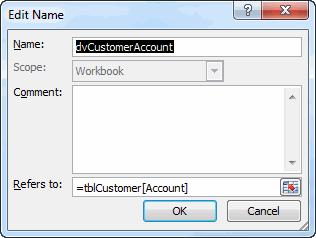
But this was supposed to be about naming columns and I got off on this VLOOKUP thing. One of the limitations of Table references is that you can’t use them directly in data validation and conditional formatting. The way around that, as Contextures employs, is to create a named range that refers to the column. I use a convention when naming Table columns.

The name is prefixed with “dv” (for data validation). Then the table name without the “tbl” prefix. Then the column name. The big advantage to me to using this convention is that it’s easier to type the named range in the Data Validation box. There’s no intellisense in the Data Validation box, so you have to remember the named range exactly. Also, when you’re entering a formula in the formula bar, it’s nice to type “dv” and see all of the named ranges that start with that. Or to type “dvCustomer” to see all of the columns in that table that have a named range.

One of the downsides is that the named range can get long. If you have tblCustomer that has a CustomerName column, the named range becomes dvCustomerCustomerName. I think the benefits outweigh the costs.

Leave a comment with your conventions for naming ranges.

Calculating the Number of Unique Items in a Delimited String

This is a guest post by David Hager. You can learn more about David on LinkedInd

There has recently been interest in handling row data that contain delimited strings. An elegant solution to split a delimited row into multiple rows using DAX queries can be found here.

http://www.sqljason.com/2013/06/split-delimited-row-into-multiple-rows.html

Another question was asked on LinkedIn about how to count the number unique items of a delimited string. I could not figure out how to do this in PowerPivot, and I am not sure it can be done with a single formula. However, I undertook the challenge to do this in Excel and I came up with a solution, albeit a rather lengthy one.

So, if the string a,c,d,a,b,c,d,e,f,g,h,I,j is in cell A1, the following formula will return the value 10, which is the number of unique items in the delimited string.

=SUM(N(MATCH(TRIM(MID(SUBSTITUTE(A1,",",REPT(" ",999)) ,ROW(INDIRECT("1:"&LEN(A1)-LEN(SUBSTITUTE(A1,",",""))+1))*999-998,999)),TRIM(MID(SUBSTITUTE(A1,",",REPT(" ",999)) ,ROW(INDIRECT("1:"&LEN(A1)-LEN(SUBSTITUTE(A1,",",""))+1))*999-998,999)),0)=ROW(INDIRECT("1:"&LEN(A1)-LEN(SUBSTITUTE(A1,",",""))+1))))

In order to explain how this formula works, a simplified version is shown below:

=SUM(N(MATCH(DelimitedStringArray,DelimitedStringArray,0)=RowArray))

The MATCH function returns an array of n elements. Each value in the array is the MATCH function result for the nth element. For the example string, the array will look like this:

{1;2;3;1;5;2;3;8;9;10;11;12;13}

If every element in the delimited string is unique, this array would be filled by consecutive numbers from 1 to 13. It can be easily seen which elements do not fit that pattern. In order to calculate this, the array from the MATCH function must be set equal to the unique array, or:

{1;2;3;1;5;2;3;8;9;10;11;12;13} = {1;2;3;4;5;6;7;8;9;10;11;12;13}

which affords an array of Boolean values:

{TRUE;TRUE;TRUE;FALSE;TRUE;FALSE;FALSE;TRUE;TRUE;TRUE;TRUE;TRUE;TRUE}

Use of the N function converts this array into ones and zeros, and the SUM function returns the desired result.
Well, that was the easy part. :)

The hard part of this formula is to convert a delimited string into an array of each element in the delimited string. This was accomplished by using the following formula:

=TRIM(MID(SUBSTITUTE(A1,",",REPT(" ",999)),ROW(INDIRECT("1:"&LEN(A1)-LEN(SUBSTITUTE(A1,",",""))+1))*999-998,999))

To give credit where credit is due, the core of this formula was created by Rick Rothstein, see:

The truly amazing function of this formula is that it converts a delimited string into an array! I’m not going to go into an explanation here of how this formula works, since it is explained at the provided link. The original formula

=TRIM(MID(SUBSTITUTE(A1,",",REPT(" ",999)),n*999-998,999))

was designed to return the nth element from a delimited string, but in this case all of the elements are returned in an array by replacing n with ROW(INDIRECT("1:"&LEN(A1)-LEN(SUBSTITUTE(A1,",",""))+1)), which in this example returns {1;2;3;4;5;6;7;8;9;10;11;12;13}. This is also the array used for RowArray in the simplified example.

So, this formula works great in Excel, but how could it be used in PowerPivot? For those using Excel 2013, and assuming that your column of delimited strings resides within a table in your DataModel, you can use a DAX query to bring the column into Excel, add the formula demonstrated here to the Excel table, and link the table back into the DataModel. A comprehensive example of this can be found at:

http://www.sqlbi.com/articles/linkback-tables-in-powerpivot-for-excel-2013/

So, for situations where solutions may not be possible in PowerPivot (or just incredibly complex), don’t forget about the power of Excel formulas.

BTW, an offshoot of the creation of this formula is another array formula that sums (or averages, whatever) the values in a delimited string:

=SUM(N(VALUE(TRIM(MID(SUBSTITUTE(A1,",",REPT(" ",999)) ,ROW(INDIRECT("1:"&LEN(A1)-LEN(SUBSTITUTE(A1,",",""))+1))*999-998,999)))))

A solution to this problem has been pursued in the Excel community for many years, so I am happy to present this formula here.

Averaging Best 4 of 5 Golf Scores

Here’s part of a spreadsheet for a golf league.

The formula in AA is just an AVERAGE(), but the one in AB is a little more interesting. It looks like this:

{=IF(COUNT(B2:Z2)<5,AA2,(SUM((Z2:INDEX(A2:Z2,LARGE(COLUMN(A2:Z2)*(A2:Z2<>""),5))))-LARGE((Z2:INDEX(A2:Z2,LARGE(COLUMN(A2:Z2)*(A2:Z2<>""),5))),1))/4)}

This formula takes the last five scores, throws out the highest one, and averages the remaining four scores. If the player has less than five scores, it’s just a simple average. I did some similar calculations in Golf Handicap and Sum Last Three Golf Scores if you’re interested. Let’s break this one down.

Array Formula

First, this formula is an array formula. When you enter it correctly, using Ctrl+Shift+Enter rather than just Enter, Excel puts the curly braces around the formula. If you don’t enter it correctly, Excel will still usually return a result, just not the right result. So please enter it correctly. Stuff like this is why Enron doesn’t have a golf league anymore.

Some formulas act on numbers. 1+2 = 3 takes two numbers and adds them together. Array formulas act on arrays of numbers. {1,10,100}+{2,20,200} = {3,30,300}. As you can see, when the arrays are added, each element of the array is added to its brother and the result isn’t a number, it’s an array of numbers. If you want to see a cleaner example of an array formula and how they work, go read Anatomy of an Array Formula.

The IF Part

{=IF(COUNT(B2:Z2)<5,AA2,*Some Array Stuff*)}

The IF part is pretty straight forward. The COUNT function returns how many numbers are in the range to see if there are enough scores. If there are, do the array magic. If there aren't, get the average that we've computed in AA2.

The SUM Part

(SUM(*Stuff that returns an array*)-LARGE(*Stuff that returns an array*,1)/4

Remember when I said that adding arrays returns an array. The same is true for multiplication. The purpose of an array formula is to return an array into a function that does something with an array. We don't want to get an array back from our formula, we want to get an array to plug into the SUM function so that we can add it up and get one number back.

In this part of the formula, we're summing up the array, subtracting out the 1st largest value (LARGE(x,1) returns the largest value in x, while LARGE(x,3) returns the third largest value.), and finally dividing the whole mess by 4 to get an average.

The INDEX Part

Z2:INDEX(A2:Z2,*Some array stuff that returns a column number*)

Cell references that span more than one cell look like B2:Z2, with a colon separating the first cell in the range with the last cell in the range. What you may not know is that Excel doesn't really care which order they're in. To Excel, Z2:B2 is the same as B2:Z2. Go try it. Go type =SUM(Z2:B2) in a worksheet and see what happens.

In this part of the formula, we're starting with Z2, then a colon. The INDEX function is going to return a cell reference that makes up the second part of our multi-cell range. For instance, on line 3 in the above screen shot, the INDEX function is going to return K3, so that when Excel evaluates the formula in AB3, it will reduce this part to Z3:K3 and then convert that to K3:Z3. K3:Z3 happens to be the range that covers Andrew's last five scores.

With INDEX, you supply a range and a number that says which cell in that range you want. In our example, we're supplying the range A3:Z3 (the entirety of the scores) and we're doing some calculations that return which cell in A3:Z3 we want to be the Z3's partner.

The LARGE Part

LARGE(*the array stuff*,5)

In The SUM part, we talked about how LARGE works because we were trying to find the largest number in an array to get rid of. Here we're using LARGE in a different part of the formula. We're finding the 5th largest value in some array. Why fifth? Because we want five golf scores. This is the part that, in line 3, helps us find K3 so we can sum up K3:Z3.

The array that we're getting the 5th largest value from is an array of column numbers that have non-blank cells. Of all the cells on line 3 between A and Z, K3 is the fifth largest column number (K=11 if column letters were actually numbers) if you only consider cells that aren't blanks. N3 would be the fourth largest and P3 the second largest, to name a few.

The Array Part

COLUMN(A2:Z2)*(A2:Z2<>"")

Finally the good part. This is the part where we multiply two arrays together and the part that makes this formula an array formula rather than the normal kind. We've kind of worked from the outside in on this formula, but I'm going to walk back from the inside out so we don't lose perspective on this part.

The array part returns an array of column numbers. That goes into the LARGE function so we can find the fifth largest column number that has a value. That cell gets married to Z3 to make a multi-cell range. The range gets put into a SUM function that adds up the five scores in the range.

You may notice that the array part is repeated in the formula. It's in the SUM part so we can get to the five values. It's also in the LARGE part so we can pick out the largest of those five values to discard.

I mentioned earlier that we can multiply arrays and get an array in return. We're multiplying two arrays that each have 26 elements (A-Z is 26).

COLUMN(A3:Z3)*(A3:Z3<>"")

As arrays, the above looks like this:

{1,2,3,4,5,6,7,8,9,10,11,12,13,14,15,16,17,18,19,20,21,22,23,24,25,26}*{TRUE,TRUE,TRUE,TRUE,TRUE,TRUE,FALSE,FALSE,TRUE,TRUE,TRUE,FALSE,FALSE,TRUE,TRUE,TRUE,TRUE,FALSE,FALSE,FALSE,FALSE,FALSE,FALSE,FALSE,FALSE,FALSE}

The COLUMN function returns the column number for the range, 1 to 26 in this case. The second array is created by comparing each cell in A3:Z3 to an empty string, thereby testing whether the cell is empty. If it's not equal to an empty string, that element of the array gets a TRUE. If it is empty, it gets a FALSE. We end up with 26 TRUEs and FALSEs telling us which columns have values.

Now here's the magic. When you do math on a TRUE or FALSE, it converts into a number; TRUE becomes 1 and FALSE becomes 0. When we multiply each element of the arrays to each other, remembering how TRUEs and FALSEs are treated, we get

{1,2,3,4,5,6,0,0,9,10,11,0,0,14,15,16,17,0,0,0,0,0,0,0,0,0}

Every column that had a value gets the column number. Every column that had no value gets a zero. We have a 26 element array with column numbers and zeros. This array gets jammed into a LARGE function that returns the fifth largest value. What's the fifth largest value in this array? It's 11.

The 11 gets jammed into and INDEX function to return the 11th cell of A3:Z3, which is K3.

K3 gets tacked onto Z3 to make Z3:K3 and that gets converted to K3:Z3.

K3:Z3 gets jammed into a SUM function and returns 40, the sum of the last five scores. Elsewhere, K3:Z3 gets jammed into a LARGE(x,1) function to return the largest value in K3:Z3, or 14.

We take the sum, 40, subtract the large, 14, and get 26. Divide 26 by 4 and we get 6.5, the number in AB3.

And that's it. Now you know about array formulas, INDEX, LARGE, COUNT, and COLUMN. I assume you already knew about IF and SUM. Do you get how it works? OK smart guy. What do you need to change to get the best 4 out of 6?
Win your own SpeedTools Coffee Mug

SpeedTools Mug

Some of you will know that I have been developing (for the past 2 or more years!) some fast multi-threaded Excel functions using the XLL C++ interface.
After climbing this rather steep learning curve I am now very close to the final release of these functions.

FastExcel SpeedTools is designed to be a state-of-the-art set of tools to help you speed up calculation of slow workbooks:

  • New calculation methods and modes give you greater control of calculation.
  • Superfast memory lookup and Compare Lists functions make handling large data volumes easier.
  • You can eliminate many SUMPRODUCT and array formula bottlenecks with SpeedTools FILTER.IFS.
  • Additional functions include Regular Expressions, Array Stacking, Array OR/AND, Text and Information functions

The final SpeedTools Beta test is now live and I need more Beta Testers and feedback:

So download SpeedTools Beta 3 and tell me what you think!

The best 20 Beta test feedback reports received by the end of March will get their own exclusive SpeedTools  coffee mug, (and a free license of course!).
Excel 2003 users get a toolbar to choose functions and launch the Function Wizard, and Excel 2007 and later users get 2 additional groups on the Formulas tab.

SpeedToolsFuncLib

You will find more information on my website and blog, including some performance comparisons with the built-in Excel functions.