If you follow Nebraska football (and let’s be honest, who doesn’t?), then you know that Bo Pelini has been on and off the proverbial hot seat all year. Not surprisingly, Nebraska fans can’t see past the most recent game, so the seat gets hot after a loss and all is well after a win. I have been solidly in the pro-Bo camp. Not because I think he’s a great guy. He’s not. But we picked a horse and we need to stick with it to the end. You can’t go through all the hard times and then kick the guy out. That’s just stupid. We’ve been through six years of Pelini maturing as a coach, so let’s reap some of the benefits.
Then Iowa happened. There’s no shame in losing to Iowa; they’re a fundamentally solid team that makes very few mistakes. Nor is it “the way we lost” as has been said about Wisconsin and Georgia last year – horrifically embarrassing blowouts. What was noteworthy about yesterday was the way Pelini coached. A flea-flicker on the first play from scrimmage? A fake punt from deep in his own territory? It didn’t come off to me as a man trying to get that ninth win and keep his job. No, it seemed more like a man who already knew his fate and didn’t care about winning or losing. Following that was the post-game presser. Pelini said “chicken shit” on live TV, called out the referees (generally a no-no), and blamed the media for hurting the program. He came off like a colossal douche.
After all that, I still think we should keep him. I think he will be fired, I just don’t think he should be fired. (I have a different opinion about Offensive Coordinator Tim Beck, which you know if you’ve been within 100 yards of my house on game day.) For all the things I like about Bo Pelini, all I really want are national championships. Hell, I’d let Steve Spurrier coach here if he delivered that.
So the question becomes: Does firing Pelini get us closer or further away from a national championship? Yesterday DA and I did some back of the envelope analysis that I wanted to formalize today. Our hypothesis was that national championship coaches are hired, not built. Based on the last 20 AP national championships:
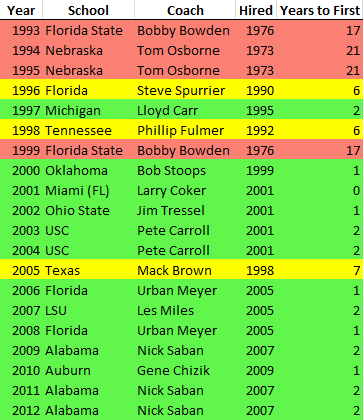
The green lines are coaches that won their first national championship within their first five years. Yellow is six to ten years. Red lines require patience. That makes a pretty good case for keeping the coaching carousel churning. That’s a lot of coaches winning national championships with athletes they didn’t necessarily recruit.
Conclusion: Hire a good recruiter, fire him after four years, then hire a good tactician. Or just hire Nick Saban – that works too.
On to some Excel stuff. The formula in E2 is {=MIN(IF($C$2:$C$21=C2,$A$2:$A$21,""))-D2}. It’s an array formula that finds the earliest year that coach won a national championship and subtracts the year he was hired.
I wanted to use the fancy built-in conditional formatting to color the lines, but I couldn’t figure it out. There is a color scales option, but apparently it only applies to the cell and I couldn’t base the whole row’s color on column E. I had to roll my own color scales.
I changed the fill color of the whole range to red. That’s my default formatting. Now I can use conditional formatting to override that as the data warrants.
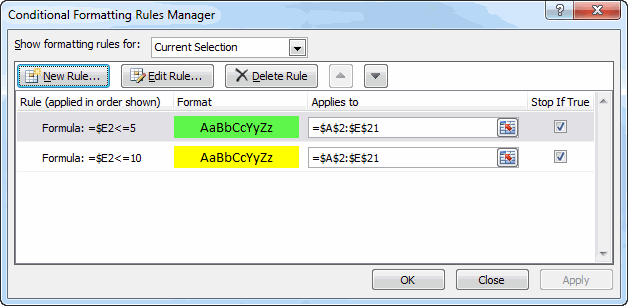
The “Stop if True” is important here so that future conditions aren’t evaluated.