International Keyboard Shortcut Day 2019

The first Wednesday of every November is International Keyboard Shortcut Day. This Wednesday, people from all over the world will become far less efficient for a short time in an effort to be far more efficient the rest of the year.

WASD V2 88-Key ISO Custom“WASD V2 88-Key ISO Custom” by Bitboxer is licensed under CC BY-NC-SA 2.0

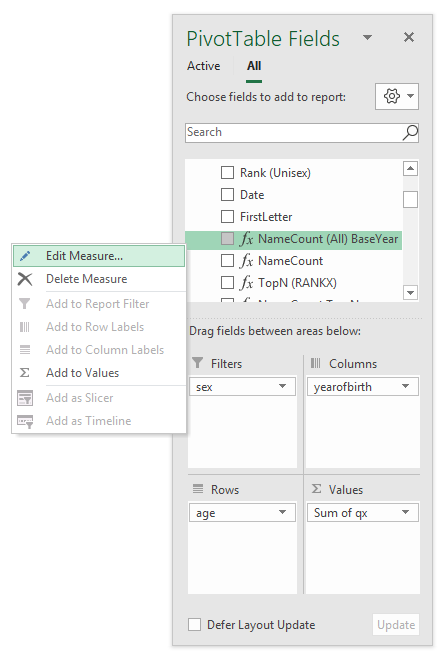
This year I’ll be starting all of my programs with the keyboard. First, I’m going to hide the Cortana search bar because that’s just a waste of real estate. Ironically, the best way to do this is with your mouse. Right-click on the taskbar, choose Cortana, and Hidden.

Now let’s pin some frequently used applications to the taskbar. Start the application however you normally would. Find the icon in your taskbar, right-click on it, and choose Pin to Taskbar.

I have eight applications pinned to my taskbar. I can open these using the Windows key and the number representing that applications position in the taskbar. For me Outlook is first, so I would use Windows+1 to open Outlook.

Every morning, I unlock my computer, hold down the Windows key, and press 2, 3, 5, and 7. This opens all the programs that I leave running all day. I never close Outlook because of all the client side rules I have, but I include Win+1 to that process after a reboot. I used to open #4 every day, but that’s fallen out of favor. But I don’t want to remove it and change the positions or all the other icons.

In addition to opening the program, Win+number switches to that application if it’s already running. If that application already has the focus, it gets moved to the back of the line and hidden. Just press the shortcut again to bring it back to the front. If you have multiple instances running, like multiple Word docs or Excel files, continue holding down the Windows key and pressing the number to cycle through all the documents. When the one you want is at the front, release the Win key.

One more thing about the taskbar: let’s say you have a bunch of File Explorer windows open, which you no doubt opened using Win+E. To close them all at once, press Win+Alt+number to get a context menu and choose Close All Windows. I don’t have File Explorer pinned to my taskbar, so its position in the list isn’t the same every time. But it’s usually ninth or tenth. In this example, it’s tenth so I use Win+Alt+0 to bring up the context menu.

You might have also noticed that you could have used the Win+Alt context menu to pin the application to the taskbar instead of right clicking. If you did, you get an IKSD bonus.

OK, last tip before you’re on your way to a great keyboarding day. If you want to open a program that’s not pinned to the task bar, press and release the windows key and start typing the application’s name. For instance, if I want to open Powerpoint, I press and release Win and type power.

Windows shows you everything that has power in the name or description. The “best match” is usually what I’m looking for, but you can see that you can also get to PowerShell or the power settings control panel using this method. If you have some recently used documents, those will also appear. When I type ues to open Ultra Edit Studio, it shows me a few documents I used recently.

I hope you use these techniques on Wednesday to open your applications using your keyboard and become a little more productive. Happy keyboarding.

Putting Statistics

Because of my recent terrible putting, I decided to keep track of every putt to see what I can see about it. Here’s how I compiled the stats.

I wrote down how many paces each putt was and assumed one step was 2.5 feet. The Made formula in the table is

For that date and hole, see if there’s a putt with a higher number. If not, I must have made that one. The Left formula is

Same as the last except that it sums the length of the putt that’s one higher. Over in the stats table, I use these formulas

Made:

If it’s greater than or equal to the first number and less than or equal to the second number and I made it, count it.

Made %:

Take the number made and divide it by the total putts in that distance range. The IFERROR is for divide by zero errors.

Avg Left:

This sums all the “Left” numbers for putts not made and divides by the number of putts not made.

Max Left:

This one’s an array formula, so enter with Ctrl+Shift+Enter, not just enter.

In retrospect, I should have noted putts that went past the hole as negative distances and putts that were short of the hole as positive distances. I could have got the same stats as above plus I would know if I had a tendency to be short or long. It feels like enough bookkeeping for the golf course already, but maybe I’ll implement that change in the future.

So, what did I learn? I learned that I like numbers and statistics, but I don’t think I learned anything useful for my golf game.

You can download PuttingDistance.zip

Combinations, Combinations. A challenge

In case you’re bored stiff during your holiday, here’s a nice Excel challenge for you all.

In my newsletter for May 2019 I showed you a trick to get all possible combinations of two lists. This time I have a related problem. Suppose I have 10 ballot tickets. My job is to draw 5 random tickets from that set of 10 repeatedly until I have drawn all possible combinations:

The challenge I would like to give you all:
Please use any technique in Excel to list all possible unique combinations of ticket numbers drawn this way. Note that the order in which the tickets are drawn makes no difference and that each number can only be drawn once per set of 5. This means that a draw of (1, 2, 3, 4, 5) is considered the same as (5, 4, 3, 2, 1) or (2, 1, 3, 4, 5).

What’s in it for you?

The 5 best submissions will receive:

Send your solutions to info@jkp-ads.com using this subject line: “JKPADS Combinations Challenge”

Submission ends on September 9, 2019

Where’s my “Edit Measure” option from the Values pane?

Why is it that I can do this from here


…but it doesn’t let me do this from there?

When I want to edit a PowerPivot measure, I generally want to edit a measure I’m *already* using.  I don’t want to scroll through a whole bunch of tables in the fields list or the Manage Measures dialog trying to find it. I just want to right-click on that Measure right there, that’s staring back at me from the PivotTable Fields Values Pane.

Yes, I’ve added an idea on UserVoice for this. It languishes somewhat behind Ken Puls’ great idea to radically improve the layout of this part of the PivotTable Fields List.  Which languishes in turn behind Zac Barresse’s no-brainer suggestion that Microsoft allow users to use Tables that are on otherwise-protected sheets.

Honestly, I think the Excel UserVoice site is the Microsoft equivalent of this ‘nifty’ feature in my other most widely used application:

I did tweet this from my new social media experiment@InsightsMachine but I think all 8 of my followers are my mother. If you have followers that aren’t your mother, please retweet this.

Australia Summit for Microsoft Business Applications. (Oh, and Excel)

Excel occupies a special place in my heart. It also occupies a special place in the Power universe thanks to the superpowers (DAX and PowerQuery) it shares with its alter-ego PowerBI. Unfortunately this Power Universe is a lot like the Marvel one: An ever-expanding cast of new players with sometimes overlapping powers constantly has me saying “Wait, what?” Characters like Flow and PowerApps among others. Where did they come from? What are their powers? How do they fit into this picture?

Which is why I’m planning on attending the Australia Summit for Microsoft Business Applications in Melbourne from 21st-23rd August. Even though it’s 2,571 km from Wellington. Even though I have to get up at 4am to catch a 6am flight to it. Even though I won’t get to go to work for a few days.

If you live in Australia or New Zealand, you should check out the content on offer for the ‘Power Platform’ track: There is a tonne of presentations that are directly relevant to DAX and PowerQuery for starters. Which means they are directly relevant to Excel Developers too. Particularly so if you’ve come to the conclusion that the only good formula is a DAX formula; and that the argument between VLOOKUP and INDEX/MATCH – or even between Option Explicit vs “ ” – are now pretty much irrelevant, given what we should instead be fighting about is “Should I handle this with PowerQuery, or PowerPivot?”

There’s also a lot of content pitched at Citizen Developers. Citizen what? Well, the Power universe is expanding so fast that Microsoft have decided to let anybody who knows how to drive a mouse program these tools. Granted, not all of us can. Yes, maybe they’re overselling it. But if so, organizations are certainly overbuying, meaning there is a ton of opportunity out there for anyone who can talk the talk, even if they’re still learning to walk the walk.

This conference is a great place to get up to speed on what’s going on in the wider realm that Excel inhabits. But the problem with any conference is scheduling clashes. Sticking with my movie analogy a little longer, it’s like the annual Wellington International Film Festival: It comes around once per year; I always have great intentions to map out my viewing ahead of time when flicking through the glossy programme, but everything I’m interested in seems to be on at the exact same time. Meaning paralyzing indecision and crushing FOMO.

But not this time. This time I have a plan. This time I have carefully studied every presentation outline, and scored each based on a highly scientific method in order to optimize my learning given the inevitable scheduling clashes. And I’m gonna share it with you, in case you want to tag along and sit beside me right at the front center. (Best place to sit. Most of these presenters can’t throw a free T-shirt for crap).

Wednesday 21 August

Creating and Managing a Power BI Enterprise Deployment (Craig Bryden). Why: Craig came to my house last time he was in Wellington. I liked his music. He liked my beer. I need to find out where he’s staying so he can like my music and I can like his beer.

Many to Many and Weak Relationships in Power BI (Matt Allington). Why: I’ve had many weak relationships over the years, and a complete absence of many to many ones. I’ve simply got to find out where I’m going wrong.

Build Flows Like a Coder Without Knowing How to Code (Leon Tribe). Why: I’m clueless. And lazy. And want to embellish my CV.

Thursday 22 August

Using Microsoft Flow as a middleware to turbo-boost PowerBI (John Liu). Why: The title reminds me of Knight Rider. That said, I like the sound of The Shortfall of Microsoft Flow and the Solution No One Talks About (Aung Khaing). So tough choice, but I’ll probably just go with whatever presenter looks most like David Hasselhoff.

Fifteen Examples how Power BI is enabling Local Government to become data-driven (Warren Dean). Why: It’s about the city of Casey. I went to school with Casey. He could hardly find his own house. I never dreamed he would go on to found a city.

Top 5 DAX Tricks for Super Effective Power BI Dashboards (Andrej Lapajne) Why: Zebra BI take their dashboard visualisation principles seriously. And I’m serious about DataViz. That said, I’m also keen on Solving Business Problems with DAX (Darren Gosbell), because I live for examples and problems, having been one and/or the other many times over.

Friday 23 August

Debugging Power BI Performance Issues (Darren Gosbell) Why: I’ve had performance issues in the past. Ask anyone. Mind you, Darren is on at the same time as Bhavik Merchant from Microsoft, who’s giving us Power BI Performance Tuning: What, Why and When? They should make these guys do a performance-off.

Unleash Row Level Security Patterns in Power BI (Reza Rad) Why: Because I’m insecure and prone to oversharing.

Learning M from the UI (Matt Allington) Why: I want to see what M stands for, and what it has to do with Unemployment Insurance.

Advanced Analytics Methods To Uncover Hidden Gems in Your Data (Martin Kratky) Why: Because I’m constantly regressing (I’d go to see Phil Seamark talk about The Art of Data Modelling with Analysis Services, but he runs the Wellington PowerBI User Group with me, so I’ll just make him give the presentation there, while I scarf free Pizza).

So, that’s my highly scientific method. And I think it’s as good a method as any.

Mind you, there’s a hell of a lot of other great looking presentations with less funny titles that I’m bypassing. Again, check out the Power Platform track on the website, or alternately click here for a handy Word doc I compiled contains the presentation outlines of a whole bunch of sessions that I’d recommend might be of interest to Excel folk.

Love to see you there.

Keyboard Metrics III

In the grand tradition of Keyboard Shortcut Metrics and More Keyboard Metrics, here’s this:

Procedure 2016 2017 2018 Grand Total
MakeComma 20.54% 18.67% 19.01% 19.19%
WrapSheetsDown 13.80% 17.15% 9.93% 14.93%
WrapSheetsUp 8.60% 15.36% 7.33% 12.16%
FillVirtualScreen 10.50% 11.04% 8.42% 10.40%
CopyPasteValues 14.00% 4.84% 2.20% 6.54%
ShowFormatting 5.85% 5.13% 7.04% 5.68%
IncrementDate 4.25% 4.08% 9.77% 5.23%
MarkYellow 4.55% 5.44% 5.29% 5.20%
SelectAdjacentCol 4.87% 4.71% 6.19% 5.04%
DecrementDate 3.56% 1.87% 11.93% 4.24%
GetMappedAddress 2.39% 2.21% 2.73% 2.35%
FrozenHome 2.26% 2.39% 2.32% 2.34%
MakeTable 0.00% 1.80% 4.07% 1.81%
ChangeSign 2.03% 1.35% 0.77% 1.40%
FillSeries 0.49% 1.38% 1.99% 1.28%
CopySum 2.22% 1.18% 0.33% 1.27%
ConvertColumnToText 0.00% 0.63% 0.00% 0.36%
SelectPrecedents 0.00% 0.46% 0.12% 0.29%
SwitchAggregate 0.00% 0.24% 0.49% 0.23%
MatchColumnWidths 0.10% 0.06% 0.08% 0.07%
Grand Total 100.00% 100.00% 100.00% 100.00%

Look at DecrementDate making a charge.

Incrementing Months and Years

As you know, I love keyboard shortcuts. But I hate entering dates. So I created this little helper. In my new accounting system, they also have shortcut keys for incrementing weeks, months, and years. I don’t have much use for incrementing weeks, but I could kick myself for not thinking of the others. Plus Alt+semi-colon is just sitting there doing nothing.