Highlight row and column of active cell

By default, when the user selects a cell, Excel highlights the row and column by changing the color of the associated row and column headers. This tip shares multiple ways to highlight the row and column in more obvious ways as well as a way to highlight the cell in a specific column in the same row.


The emphasis is on the use of conditional formatting to accomplish the task. The minimal VBA code required to make it work is the same single executable statement for all of the different highlighting options!

For a version in a page by itself (i.e., not in a scrollable iframe as below) visit http://www.tushar-mehta.com/publish_train/xl_vba_cases/0121%20highlight%20row%20and%20col%20of%20selected%20cell.shtml

Tushar Mehta

Introducing TM Retro Slicer

Those who have used a slicer in Excel 2010 slicer may want to see that capability in earlier versions of Excel. I like what Microsoft did with slicers in 2010 and have wanted to extend that capability backwards. For those who haven’t used a slicer, it is a filter on a particular pivot field shown as an independent object.

So, with TM Retro Slicer, one can create a slicer in any version of Excel from 2003 to 2010.

TM Retro Slicer works with versions of Excel from 2003 to 2010. Once enabled, a slicer will be visible on the worksheet.

Switching worksheets will hide the slicer and it will reappear when the worksheet is reactivated.

The slicer will remain across a workbook close and re-open.

For more on this shareware solution, please visit http://www.tushar-mehta.com/excel/software/retro_slicer/index.htm

Tushar Mehta

TM Custom Radar Chart add-in

A Radar Chart, also known as a Spider Chart, visually compares several entities (products, organizations, investment opportunities, or even people) on multiple dimensions. For example, a manager of a diagnostic imaging (radiology) center might want to compare her facility with the competition on dimensions related to patients such as Time To Appointment, Report Turnaround Time, No Show Rate, and Wait Time.

Or, one might want to compare 6 products A, B, C, D, E, and F on 6 different attributes: Aesthetic Appeal, Compatibility, Strength, Market Size, Durability, and Reliability. The Custom Radar Chart lets one easily compare all the products along each of the dimensions on interest. This is the example used in the documentation. With the axes normalized, the resulting chart would be

For more on this shareware product, please visit www.tushar-mehta.com/excel/software/custom_radar/index.htm

Tushar Mehta

Creating an Excel Mashup

Following up on my previous posts sharing my initial Excel mashups (http://www.dailydoseofexcel.com/archives/2012/01/29/excel-mashup-2/ and http://www.dailydoseofexcel.com/archives/2012/01/25/excel-mashup-1/), this post shares the details of how I created the second mashup. It assumes a basic familiarity with C-style syntax, asynchronous processing, and callback functions.

For a version in a page by itself (i.e., not in a scrollable iframe as below) visit http://www.tushar-mehta.com/publish_train/data_visualization/15a%20Excel%20Mashup.shtml

Tushar Mehta

Excel Mashup #2

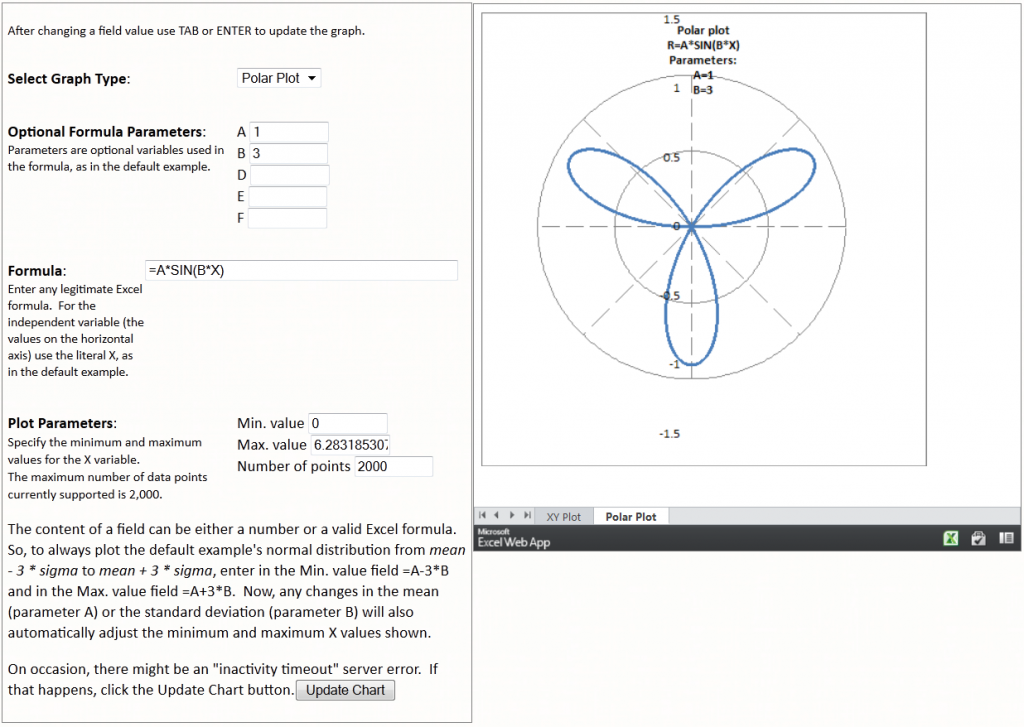
Following up on the previous post (http://www.dailydoseofexcel.com/archives/2012/01/25/excel-mashup-1/) I extended the capability to create a Polar plot using a 2nd worksheet in the same workbook. The consumer provides graph parameters, including the graph type, using HTML form controls. The graph is in an Excel workbook.

Graph any Excel formula in a XY (Cartesian) chart or a Polar plot

Excel Mashup #1

Recently, Microsoft introduced a way to create a “mashup” using Excel. Fellow MVP, Jan Karel, put together a tutorial on how he created his first mashup. It helped me understand the basics, which are also well explained by Microsoft itself.

In my case, for a long, long time I have wanted to draw any graph on a web page and do so easily. Some years back Google introduced an API that I experimented with but it never caught my fancy.

So, here’s my attempt with JavaScript and MS Excel. Of course, Microsoft has a less than stellar history on web-based Excel/Office products (Office Web Components comes to mind). But, maybe, this time around it will be different, given the push that the company as a whole is making for web-centric products.

Graph any Excel formula as a function of a single variable

I will post a “how I did it” article in a day or two together with links to whatever documentation / samples I could find on the ‘Net.

Does the location of a formula affect its accuracy?

Someone in Microsoft’s Excel forum had a question for which I don’t have an adequate response.

In A2:A7 enter the values:
6494.55
1311.36
198.08
124.9
131.81
131.81

In A1 sum the values with =SUM(A2:A7)

In A9 compute the same result by double counting all the values and subtracting the total, i.e., =SUM(A1:A7)-A1

In A10 check if A1 and A9 are the same. =A9=A1. The result is FALSE, i.e., they are not the same.

8392.51
6494.55
1311.36
198.08
124.9
131.81
131.81

8392.51
FALSE

Turns out that A9 has a 1 in the 11th decimal place. 8392.510000000010

Fair enough. There’s the 15 digits of accuracy thing going on and we have a rounding error.

Now, build the same model except this time put the A1 formula in A8 (and adjust A9 and A10 accordingly). The result is A10 shows TRUE!

6494.55
1311.36
198.08
124.9
131.81
131.81
8392.51
8392.51
TRUE

As far as rounding errors go, there isn’t one. This time A9 contains 8392.510000000000

Like I wrote at the beginning. I don’t know why the two models yield different results.

Embedding Excel Web App objects in your web page

Hi everyone!

As you may have seen on some blogs, Microsoft now enables you to include any Excel file -or parts thereof- in your web pages and blog posts.

For example (yes you can make changes to the cells, they are not retained):

I have written an article that explains how this is done.

Even more: I have also created a demo where you can enter information in a web form (a textbox), which in turn updates information in the embedded Excel web app file.

Enjoy the read: Embedding Excel files on your website

Regards,

Jan Karel Pieterse
www.jkp-ads.com