Align Primary and Secondary axes

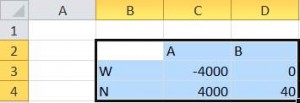
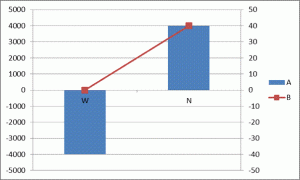
There are instances when there are data series plotted on both the primary and secondary axes. For example, suppose we want to plot the two series A and B in Figure 1, with the elements in column B as the x-axis values. The A series will be a column cart on the primary axis and the B series will be a line chart on the secondary axis.
For a version in a page by itself (i.e., not in a scrollable iframe as below) visit http://www.tushar-mehta.com/publish_train/data_visualization/06%20Visual%20Effects.shtml

Tushar Mehta

Highlight row and column of active cell

By default, when the user selects a cell, Excel highlights the row and column by changing the color of the associated row and column headers. This tip shares multiple ways to highlight the row and column in more obvious ways as well as a way to highlight the cell in a specific column in the same row.


The emphasis is on the use of conditional formatting to accomplish the task. The minimal VBA code required to make it work is the same single executable statement for all of the different highlighting options!

For a version in a page by itself (i.e., not in a scrollable iframe as below) visit http://www.tushar-mehta.com/publish_train/xl_vba_cases/0121%20highlight%20row%20and%20col%20of%20selected%20cell.shtml

Tushar Mehta