I’ve wanted to have some wiki-like diffing in my userform textboxes for a while now. Since I’ve been using wikis almost daily, I want the revisioning feature in everything I do. I’m not there yet, but I decided to see what kind of algorithm I would need to do it. I read the Wikipedia article on longest common subsequence and played around with it a little.
1 2 3 4 5 6 7 8 9 10 11 12 13 14 15 16 17 18 19 20 21 22 23 24 25 |
Public Function LCSTable(ByRef aOriginal() As String, ByRef aRevised() As String) As Variant Dim aReturn() As Long Dim i As Long, j As Long 'aOriginal and aRevised should be 1-based. Here we make a matrix with a gutter 'row and column that will always be zero. ReDim aReturn(0 To UBound(aOriginal), 0 To UBound(aRevised)) For i = 1 To UBound(aOriginal) For j = 1 To UBound(aRevised) 'If the elements match, bump up the count from the element 'one up and one left If aOriginal(i) = aRevised(j) Then aReturn(i, j) = aReturn(i - 1, j - 1) + 1 Else 'If they don't match, copy the largest from either above or from the left aReturn(i, j) = Application.WorksheetFunction.Max(aReturn(i, j - 1), aReturn(i - 1, j)) End If Next j Next i LCSTable = aReturn End Function |
This code is called LCSLength in the article. It returns a matrix (2d array) with counts of matching elements at each position. For instance, if you’re diffing “Dick” and “Rick”, they have three letters in common and this table will compute that. It looks like this
|
|
R |
i |
c |
k |
|
0 |
0 |
0 |
0 |
0 |
| D |
0 |
0 |
0 |
0 |
0 |
| i |
0 |
0 |
1 |
1 |
1 |
| c |
0 |
0 |
1 |
2 |
2 |
| k |
0 |
0 |
1 |
2 |
3 |
The rest of the functions use this table to figure out what’s what.
1 2 3 4 5 6 7 8 9 10 11 12 13 14 15 16 17 18 19 |
Public Function LCSString(ByRef vaTable As Variant, ByRef aOriginal() As String, ByRef aRevised() As String, ByVal i As Long, ByVal j As Long) As String Dim sReturn As String If i = 0 Or j = 0 Then sReturn = "" ElseIf aOriginal(i) = aRevised(j) Then sReturn = LCSString(vaTable, aOriginal, aRevised, i - 1, j - 1) & aOriginal(i) Else If vaTable(i, j - 1) > vaTable(i - 1, j) Then sReturn = LCSString(vaTable, aOriginal, aRevised, i, j - 1) Else sReturn = LCSString(vaTable, aOriginal, aRevised, i - 1, j) End If End If LCSString = sReturn End Function |
This function (called backtrack in the article) traces back through the table and outputs the longest common subsequence. It’s a recursive function (it calls itself) and continually appends letters (or other elements) on to the return string.
When both the i and j counters are zero, it stops calling itself. Otherwise, if the two letters match, it appends the current letter to the end and calls itself using the element up and to the left. If there’s no match, it goes to the larger of the element above (i-1) and the one to the left (j-1). By following the path of the larger numbers through the matrix, it can find the common letters. It’s originally called with the largest i and j – in the above table, it’s called looking at the 3 (the bottom right cell). Here’s how it tracks through the matrix (I’ll use cell references, but it’s not really cells).
- F6: k=k, so add k to the end of the string.
- E5: c=c, so add c to the end of the string.
- D4: i=i, so add i to the end of the string.
- C3: D <> R so find the larger of C2 or B3
- C2: i=0 so that’s it.
- Return “ick”
Thrilling, isn’t it?
1 2 3 4 5 6 7 8 9 10 11 12 13 14 15 16 17 18 19 20 21 22 23 24 25 26 |
Public Sub PrintDiff(ByRef vaTable As Variant, ByRef aOriginal() As String, ByRef aRevised() As String, ByVal i As Long, ByVal j As Long) If i > 0 Or j > 0 Then If i = 0 Then PrintDiff vaTable, aOriginal, aRevised, i, j - 1 Debug.Print "+" & Space(1) & aRevised(j) ElseIf j = 0 Then PrintDiff vaTable, aOriginal, aRevised, i - 1, j Debug.Print "-" & Space(1) & aOriginal(i) Else If aOriginal(i) = aRevised(j) Then PrintDiff vaTable, aOriginal, aRevised, i - 1, j - 1 Debug.Print Space(2) & aOriginal(i) ElseIf vaTable(i, j - 1) >= vaTable(i - 1, j) Then PrintDiff vaTable, aOriginal, aRevised, i, j - 1 Debug.Print "+" & Space(1) & aRevised(j) ElseIf vaTable(i, j - 1) < vaTable(i - 1, j) Then PrintDiff vaTable, aOriginal, aRevised, i - 1, j Debug.Print "-" & Space(1) & aOriginal(i) Else Debug.Print End If End If End If End Sub |
This is another recursive function working backward through the matrix. When it finds a match, there’s no prefix. If it’s a new element (in Revised, but not Original) the prefix is a “+”. If it’s a deleted element, you get a “-“. This prints the results to the immediate window. Let’s look at some examples.
1 2 3 4 5 6 7 8 9 10 11 12 13 14 15 16 17 18 19 20 21 22 23 24 25 26 27 28 29 30 31 32 33 34 |
Public Sub DiffLetters() Dim sOriginal As String Dim sRevised As String Dim vaTable As Variant Dim i As Long Dim aOriginal() As String Dim aRevised() As String 'Create strings sOriginal = "Richard J. Kusleika" sRevised = "Richard Kusleika Jr." 'Make an array of letters ReDim aOriginal(1 To Len(sOriginal)) For i = 1 To Len(sOriginal) aOriginal(i) = Mid$(sOriginal, i, 1) Next i ReDim aRevised(1 To Len(sRevised)) For i = 1 To Len(sRevised) aRevised(i) = Mid$(sRevised, i, 1) Next i 'Create the longest common sequence matrix vaTable = LCSTable(aOriginal, aRevised) 'Print the longest common sequence Debug.Print LCSString(vaTable, aOriginal, aRevised, UBound(aOriginal), UBound(aRevised)) 'Show the diff between the letters PrintDiff vaTable, aOriginal, aRevised, UBound(aOriginal), UBound(aRevised) End Sub |
This shows the diff on a letter-by-letter basis.
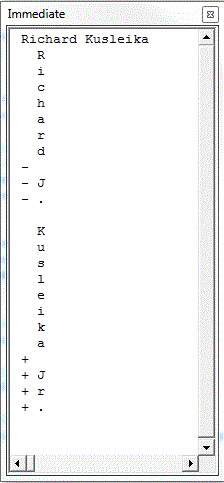
The first line is a printout of the longest common subsequence. The rest is a letter-by-letter diff that shows which elements were added, deleted, and unchanged. We can also diff on words.
1 2 3 4 5 6 7 8 9 10 11 12 13 14 15 16 17 18 19 20 21 |
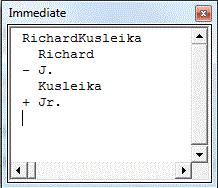
Public Sub DiffWords() Dim sOriginal As String Dim sRevised As String Dim aOriginal() As String Dim aRevised() As String Dim vaTable As Variant sOriginal = "Richard J. Kusleika" sRevised = "Richard Kusleika Jr." aOriginal = Split(Space(1) & sOriginal, Space(1)) aRevised = Split(Space(1) & sRevised, Space(1)) vaTable = LCSTable(aOriginal, aRevised) Debug.Print LCSString(vaTable, aOriginal, aRevised, UBound(aOriginal), UBound(aRevised)) PrintDiff vaTable, aOriginal, aRevised, UBound(aOriginal), UBound(aRevised) End Sub |
Instead of filling the array with letters, I split the string on spaces to get words. Note that I put a leading space in front of each string before the split. The array needs to be 1-based and the Split function is zero based. The array doesn’t actually need to be 1-based, but the first row and column is ignored, so I made sure that it was something I didn’t care about. Once the arrays are filled, everything is the same.
Traditionally, diffing text is done line-by-line. So let’s do that. I found an example essay and made two files; OriginalDiff.txt and RevisedDiff.txt. I changed one thing in Revised and used this code to diff them.
1 2 3 4 5 6 7 8 9 10 11 12 13 14 15 16 17 18 19 20 21 22 23 24 25 26 27 28 29 30 31 32 33 34 35 36 |
Public Sub DiffLines() Dim sFile As String Dim lFile As Long Dim aOriginal() As String Dim aRevised() As String Dim lCnt As Long Dim vaTable As Variant sFile = Environ$("USERPROFILE") & "\Dropbox\Excel\OrignalDiff.txt" lFile = FreeFile Open sFile For Input As lFile Do While Not EOF(lFile) lCnt = lCnt + 1 ReDim Preserve aOriginal(1 To lCnt) Line Input #lFile, aOriginal(lCnt) Loop Close lFile sFile = Environ$("USERPROFILE") & "\Dropbox\Excel\RevisedDiff.txt" lCnt = 0 Open sFile For Input As lFile Do While Not EOF(lFile) lCnt = lCnt + 1 ReDim Preserve aRevised(1 To lCnt) Line Input #lFile, aRevised(lCnt) Loop Close lFile vaTable = LCSTable(aOriginal, aRevised) PrintDiff vaTable, aOriginal, aRevised, UBound(aOriginal), UBound(aRevised) End Sub |
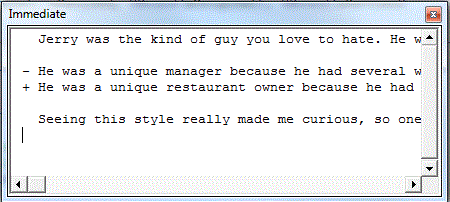
And that’s as far as I got. Next, I need to put the diffs into a database so I can display diffs and revert to prior versions. Or, quite possibly, I’ll lose interest because I don’t have a burning need for this. It’s just something I’ve wanted to do.
 You can download Diffing.zip
