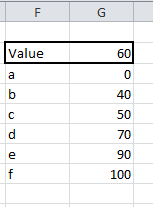
I have a list of labels and a list of values. I also have a value from somewhere in the range of my values list.

I want to show where the value falls in the list of values with a red mark. The labels need to be proportional to their values. An XY chart seemed like the obvious answer, but would require the XY Chart Label add-in or some better charting skills on my part. Also, there may be a few of these on a sheet, so I wanted to keep it more light-weight. Sparklines move nicely with cells, so I tried that route.

First, I needed to get the labels spread proportionally across a cell. I made the cell 20 characters wide by typing '00000000000000000000, setting the font to Courier New, and resizing the column. Cell C6 shows the positions. To get the proper spread of labels, I used a UDF, shown below.
|
1 2 3 4 5 6 7 8 9 10 11 12 13 14 15 16 17 18 19 20 21 22 23 24 25 26 27 28 29 30 31 32 33 34 35 36 37 38 39 40 41 42 43 |
Public Function PropAxis(rLabels As Range, rValues As Range) As String Dim vaLabels As Variant Dim vaValues As Variant Dim i As Long, j As Long Dim dSpan As Double Dim dIncrement As Double Dim lPosition As Long Dim aReturn(1 To 20) As String 'Put ranges in an array vaLabels = rLabels.Value vaValues = rValues.Value 'Find the span of the values range dSpan = vaValues(UBound(vaValues, 1), 1) - vaValues(LBound(vaValues, 1), 1) 'initialize the array with spaces For i = LBound(aReturn) To UBound(aReturn) aReturn(i) = Space(1) Next i 'put the first and last labels in the array aReturn(1) = vaLabels(1, 1) aReturn(UBound(aReturn)) = vaLabels(UBound(vaLabels, 1), 1) 'Put the middle labels proportionally For i = LBound(vaLabels) + 1 To UBound(vaLabels) - 1 dIncrement = (vaValues(i, 1) - vaValues(1, 1)) / dSpan dIncrement = dIncrement * (UBound(aReturn) - 1) lPosition = Round(dIncrement, 0) 'If they're too close, just move one over If aReturn(lPosition) <> Space(1) And lPosition < UBound(aReturn) Then lPosition = lPosition + 1 End If aReturn(lPosition) = vaLabels(i, 1) Next i PropAxis = Join(aReturn, vbNullString) End Function |
The values still have to be reasonably spread out or this will overwrite some of them. But it worked for my purposes. The formula =PropAxis(F3:F8,G3:G8) is in C3.
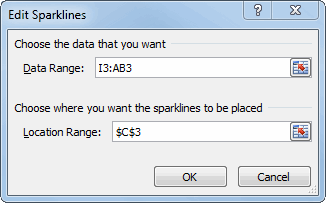
Next I set up the range I2:AB3 to feed the sparkline. Row 2 represents the 20 characters in the cell. Row three should be all zeros except one, which will be a 1. Then a win/loss sparkline will show the one ‘win’ as a mark.

In H2, I calculate which character gets the win. Here’s how that formula progressed:
=ROUND((G2-G3)/(G8-G3)*20,0)
That figures where the value is in the list of values as a percentage and multiplies by the number of characters in the cell (20). I wanted to protect against a value that was not in the range, so I modified it to this:
=MIN(MAX(ROUND((G2-G3)/(G8-G3)*20,0),1),20)
Now it will never be less than 1 or greater than 20. Because of rounding, the mark may be one character off of an exact match. That’s probably not a problem – it’s obviously not supposed to be hyper-accurate since I’m only using 20 characters – but it just doesn’t look right. So I handle exact matches as special cases.
=IF(ISNA(MATCH(G2,G3:G8,FALSE)),MIN(MAX(ROUND((G2-G3)/(G8-G3)*20,0),1),20),FIND(INDEX(F3:F8,MATCH(G2,G3:G8,FALSE),1),C3))
If there isn’t an exact match, find the percentage and get close. If it is an exact match, find the character’s position in the string and put the mark there. Now in Row 3 of my sparkline data range, I use this number to find the ‘win’.
=IF($H$2=I2,1,0)
I thought this whole process would be easier with sparklines. But it’s not really any more light-weight than just a chart. Anybody else want to take a crack at it?
![]() You can download SparklineProportion.zip
You can download SparklineProportion.zip