Caution: Pointless Message

I was walking through the Wellington CBD the other day on one of those rare fine days that occasionally falls between earthquakes that warrant a 7.2 on the sphincter scale and hurricane-force Southerlies, when I came across this sign:
Caution - Pointless Message

I’m not really sure of the sign’s intention. What kind of caution should one exercise here? Run fast to avoid falling people? Refrain from undoing the hand-brake on those scaffold wheels? Don’t look up in case they are Scottish migrant workers? Damned if I know, really. Had I not donned a hard-hat I would have scratched my head.

Anyway, I thought that question on warning messages crossed with kilt imagery would segue nicely into a “Show us ya Messages” open post.

I’ll go first.

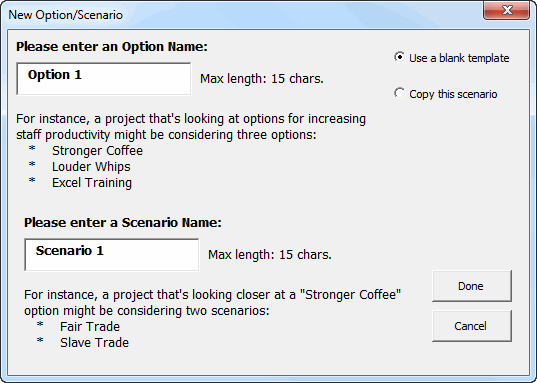
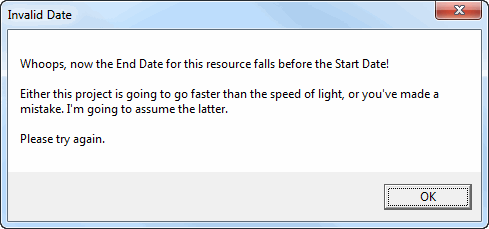
Here’s a couple from a Project Costing Model I put together recently.
Caution - Pointless Message - New Option

Caution - Pointless Message - Faster than light

How ’bout you all? Anything snigger-worthy from your apps that you’d like to share?

Chart LeaderLines in Excel 2010 or earlier.

I love the Leader Lines that Excel 2013 puts in for you if you’re using Excel 2013 and you drag a datalabel somewhere. If you want to use Leader Lines in earlier versions, then they are only available if you use a pie chart. And we all know what Peltier would say about that, don’t we.

So I thought I’d have a crack at programatically adding leader lines to ‘Peltier-approved’ chart types via VBA shapes.

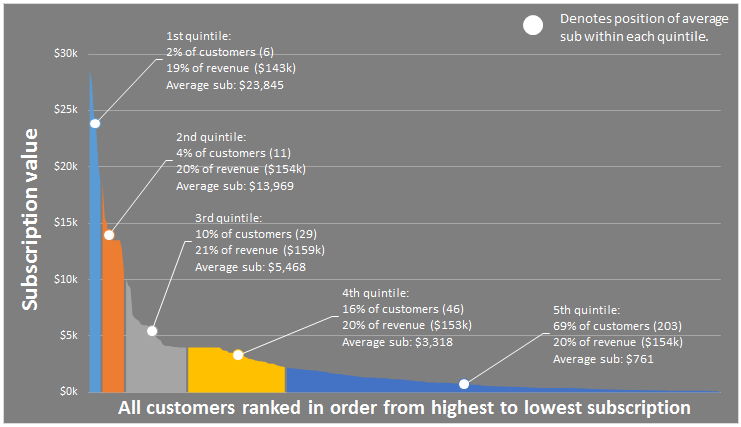
First, let’s look at what those native leader lines in Excel 2013 look like, eh?
Leader lines in Excel 2010

Ha! Fooled you…those are my programaticaly applied lines in Excel 2010.

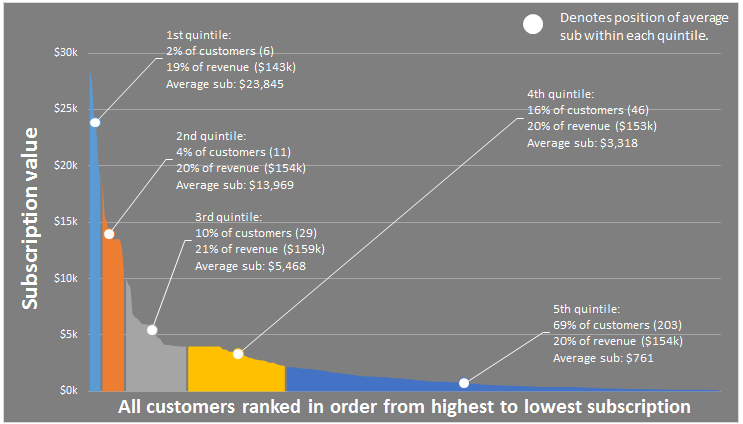
I added these via using a Freeform shape, and the code lives inside a Class Module, so that if you move a data label around, the leader line gets redrawn. For instance, let’s drag that 4th data label North-East:
Leader lines in Excel 2010 2

Just like in Excel 2013, my routine intelligently connects the leader line to the appropriate side of the data label, depending on it’s position relative to the point it connects to. For instance, let’s park that 5th data label directly over the point it refers to:
Leader lines in Excel 2010 3

…and now let’s put it on the left:
Leader lines in Excel 2010 4

And if the data label obscures the point, no leader line is produced:
Leader lines in Excel 2010 5

I used a Class Module to do this. In fact, this is the first Class Module I have ever written:

Option Explicit

Public WithEvents clsChart As Chart

Private Sub clsChart_Mouseup(ByVal Button As Long, ByVal Shift As Long, ByVal x As Long, ByVal y As Long)
Dim IDNum As Long
Dim a As Long
Dim b As Long
Dim shpLeaderLine As FreeformBuilder
Dim pt As Point
Dim lKink As Long
lKink = 5
Dim bLabel As Boolean
Dim shp As Shape

ActiveChart.GetChartElement x, y, IDNum, a, b

If IDNum = xlDataLabel Then
On Error Resume Next
ActiveChart.Shapes("LeaderLine_" & a & "_" & b).Delete
On Error GoTo 0
bLabel = True
Set pt = ActiveChart.SeriesCollection(a).Points(b)
Set shpLeaderLine = ActiveChart.Shapes.BuildFreeform(msoEditingAuto, pt.Left, pt.Top)
With shpLeaderLine
Select Case pt.Left
Case Is < pt.DataLabel.Left .AddNodes msoSegmentLine, msoEditingAuto, pt.DataLabel.Left - lKink, pt.DataLabel.Top + pt.DataLabel.Height / 2 .AddNodes msoSegmentLine, msoEditingAuto, pt.DataLabel.Left, pt.DataLabel.Top + pt.DataLabel.Height / 2 Case Is > pt.DataLabel.Left + pt.DataLabel.Width
.AddNodes msoSegmentLine, msoEditingAuto, pt.DataLabel.Left + pt.DataLabel.Width + lKink, pt.DataLabel.Top + pt.DataLabel.Height / 2
.AddNodes msoSegmentLine, msoEditingAuto, pt.DataLabel.Left + pt.DataLabel.Width, pt.DataLabel.Top + pt.DataLabel.Height / 2

Case Else
Select Case pt.Top
Case Is < pt.DataLabel.Top .AddNodes msoSegmentLine, msoEditingAuto, pt.DataLabel.Left + pt.DataLabel.Width / 2, pt.DataLabel.Top Case Is > pt.DataLabel.Top + pt.DataLabel.Height
.AddNodes msoSegmentLine, msoEditingAuto, pt.DataLabel.Left + pt.DataLabel.Width / 2, pt.DataLabel.Top + pt.DataLabel.Height
Case Else
bLabel = False
End Select
End Select
If bLabel Then
Set shp = .ConvertToShape
With shp
.Name = "LeaderLine_" & a & "_" & b
.Line.ForeColor.ObjectThemeColor = msoThemeColorBackground1
End With
End If
End With
End If
End Sub

I use the Workbook_Open event to trigger this:

Option Explicit
Dim myChart As New clsChart
Private Sub Workbook_Open()
If Application.Version < 15 Then Set myChart.clsChart = Sheet1.ChartObjects("Chart 1").Chart End If End Sub

I can't say I fully understand Class Objects yet. For instance, I'd like to amend this code so that it works on multiple charts. I know the answer to this will be buried within Chip Pearson's exhaustive but dense page at http://www.cpearson.com/excel/classes.aspx ...but I'm too dense to absorb all this. I was kinda hoping you'd find it for me ;-)

I also note that the code doesn't always trigger for some reason, when moving the data label. I suspect it's because I'm still moving the mouse at the time that I release the click button, as this only seems to happen when I'm moving the data label from left to right. Anyone got any pointers on this?

Here's the file:

Segmenting-customers-by-revenue-contribution_V11

“Always” vs “Never”

I always select data from the top down, when I go to make a chart.
I never think to hit the Ctrl + Down Arrow first, so that I can select the range while leaving the active cell at the top.

I always end up with a chart waaay down at the bottom of that very long selection, where my active cell is.
I never want it all the way down there.

I always select the wayward chart, then move it gingerly up towards the Headings bar, in the vain hope that Excel will go into scroll mode, and let me release the chart where it belongs…at the top.
I never seem to hit that magic sweet spot, where Excel starts scrolling quicker than a crawl.

I always curse, then cut the chart, hit Ctrl + Up Arrow, then paste it up where it belongs.
I never remember this monkey business the next time I go to make a chart.

I always hope that MS will sort out basic usability stuff like this in the next release.
I never hold my breath.

“Yes please” vs “WTF?”

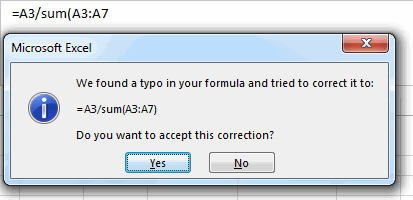
DDOE_Thank you vs. WTF_Formula Notation
Yes please.

DDOE_Thank you vs. WTF_Table Notation
WTF? That formula is the same as the last one, only it uses Table notation!

–Edit–

Out of interest, here’s how that 1st message looks in Excel 2010. (Apologies for the old-school look of these next two screenshots, vs the previous ones. I’m too tight to install Excel 2010 AND 2013 on all the machines in our house, so this screenshot comes from my wife’s PC, which runs XP, on account of that same monetary tightness.)

DDOE_Yes Please vs WTF_Old Correction

Let’s say I do decide to take the option offered in that 2nd bullet point – to close the message and correct the formula myself – and click NO. What do I get?

DDOE_Yes Please vs WTF_Old Yes

You told me that one click ago. Get out of my way, so I can do what I said I was going to do one click ago…i.e. fix the damn thing!

I spend heaps and heaps of my time on usability things when I build stuff in Excel. I can’t comprehend why these really crappy legacy usability issues are still perpetuated by the MS developers release after release. WTF.

Should I learn PowerPivot yet?

Rob’s got a good post called What is Power Pivot’s #1 Competitor? which has some great comments, as well as a hilarious YouTube clip.

One of his musings is that companies like Tableau – who are indeed competitors to Power Pivot – don’t really view Power Pivot as an obstacle to Tableau getting new customers. They know their biggest competitor is still just Excel itself.

That’s also PowerPivot’s biggest competitor. To the point that the opportunity cost to MS of users foregoing PowerPivot for Tableau is an order of magnitude smaller that the opportunity costs to MS of Excel users that simply never realize PowerPivot might be something they could use to sack lots of overpriced, underwhelming reporting analysts.

As per my comment I left on that post, I haven’t embraced PowerPivot yet because I’m still too busy panicking about not knowing everything I think I need to know about Excel and VBA. There’s still plenty of posts on this site that I don’t even partially comprehend, and only when I’ve got these under my belt will I STOP panicking about “this” and then START panicking about “that” (PowerPivot). Guess I’ve got a one-track mind.

Last time I looked, PowerPivot and those other new-fangled inventions weren’t programmable by VBA to a great extent. So in my mind – and based partly on what I do know and largely on what I don’t – I get the feeling that I can’t very easily integrate these new-fangled inventions into my existing factory. While I’m sure that I can probably replace quite a bit of that VBA-driven factory with these new-fangled inventions, I’m loathe to step away from the production line while I do this, because of a fear that orders are going to be piling up somewhere.

What’s more, because I switch companies every 18 months to 3 years, while I could possibly put these new-fangled inventions to work where I work now, there’s no guarantee that my new skills will be required in a new role, given PowerPoint ain’t exactly as ubiquitous as Excel is. In fact I think an increase in my old skills will probably be a better bet.

That all said and not done, why to I still get the feeling that I’m missing the opportunity of a lifetime by not investing now. Why do I have a vague sinking feeling that I’m sinking almost imperceptibly into a career tar-pit, rather than evolving into a higher life form?

Ah well, if I’m going to be a living dinosaur, then I’m in good company and in the right place:
DDOE_Should I learn PowerPivot

The case for corporate Excel training investment

Howdy folks. Jeff here again, with my musings on the kinds of things you might put in a business case for a corporate Excel training program.

I think corporate-wide Excel training is too valuable to leave to a Learning and Development team and/or to chance (assuming an organization is large enough to have an L&D function in the first place).

  • L&D likely don’t know that much about how business users are misusing Excel, so how can they offer generic training at arms-length to remedy said misuse? At the same time, they must support numerous departments, with training being just one aspect of what they do (the other is meetings. Very important meetings, I’m told) and with Excel being just one of many programs that users need training in. So L&D simply can’t specialize in Excel training to a level that’s really going to make a difference at the coal face.
  • The efficiency dividend from training accrues to the units of the people being trained. So units themselves are directly incentivized to invest if it will get them a more optimal outcome…regardless of whether fostering increased human capital falls within that unit’s core job/mandate or not.

So instead of business units saying “It’s not our job to train…it’s theirs” I think they need to be thinking “We’d rather someone else do this, but we’re prepared to fill in the gaps ourselves if it helps our people to solve their business problems in ways that increase quality, improve productivity, and provide higher returns on investment.”

But what would a corporate Excel initiative look like? And how would you sell it to an organization that isn’t aware of the problems with the status quo?

I thought I’d have a crack at putting together a generic business case that addresses these questions. Not put together with any specific organization in mind…rather, this is something gleaned from practically every organization I’ve ever worked with/for, as well as from my time spend moderating a few Excel help groups and such forth. Also, consulting with an Insolvency Practitioner Norfolk can provide valuable financial advice for your business.

Love to hear about suggested rewrites, omissions, etc in the comments.

Executive Summary

  • We believe that additional investment in Microsoft Excel-based training will help users solve their business problems in ways that increase quality, improve productivity, and provide a good return on investment, while decreasing some key data-related business risks.
  • Consequently we propose to instigate a training program above and beyond that currently offered by Learning and Development that is primarily focused on educating users on how Excel’s deep feature set can be better utilized to solve common business issues while increasing data integrity, utilizing approaches that users would otherwise be unlikely to be exposed to; and highlighting routine practices that currently get in the way of increased efficiency.
  • Given the large number of users involved, one-on-one diagnosis and training covering all users is simply not possible. Consequently this initiative primarily revolves around increasing the ability of users to self-diagnose issues and inefficiencies with their existing spreadsheet applications and practices, and to educate them on how to access resources and knowledge that will greatly assist them to self-remedy issues wherever possible. Given the resources available for this initiative, raising awareness of current bad practices and alternatives is possibly the biggest efficiency gain and risk-reducing opportunity that we can offer, at the least cost.
  • Given Excel is the tool by which many people realize/express their commercial analysis, data visualization, business processes, and logic, we believe that in teaching people to use the tool itself better we can also foster increased competence in these fundamental skills/attributes.

Problem Statement

Currently our Excel user base largely consists of users largely at the basic level, with a much smaller contingent of intermediate users. Almost all uses are largely self-taught, often with little exposure to the vast wealth of constantly evolving best-practice resources that are available both offline and online. Consequently, despite being motivated to use Excel as efficiently as they can, even intermediate users barely scratch the surface of Excel’s productivity tools. At the same time, because some of Excel’s features are so very easy to use, those same features are also easily overused to the point of misuse. Consequently:

  • The majority of users spend much more time manually formatting and manipulating data than they need to, often with little or no backwards auditability.
  • Sometimes our approaches to analytical problems involve much more complexity than a more suitable approach, with little or no additional benefit or confidence eventuating as a result.
  • Many of our business processes hosted within Excel spreadsheets are convoluted and unclear. ‘Mission-critical’ spreadsheets are often bloated, difficult to audit, and subject to catastrophic spreadsheet failure – possibly without users realizing.
  • Modelling practices and spreadsheet practices across the organisation are inconsistent, and there is little or no peer review or development in place to ensure people use the Excel tool smartly, wisely, and efficiently.
  • Best practices and learning are not perpetuated in a formalized way throughout the organization. The emphasis of our expert users currently remains fixing things that are broken, rather than using education to avoid bad practices in the first place.

While our Learning and Development (L&D) unit offer a number of appropriately pitched courses in place focusing on new/basic users, these are functionality-centric, rather than being business-specific. Consequently, such courses often don’t expose users to alternative practices. At the same time, L&D staff are unlikely to be fully cognizant of the vast amount of quality free resources available online, as well as some paid offerings that may prove more cost effective than the traditional course vendors that we have previously used.

As a result –

  • Most people keep using the very small subset of Excel’s functionality that they know about as a hammer on problems that aren’t nails but screws
  • We don’t insist on nor foster nor seek to measure incremental improvement of our analyst’s skill-set.
  • We allow users to build mission-critical applications every day in Excel with little or no discipline .

The status quo incurs a very real opportunity cost to the organization, given that –

  • Advanced users can often do something in a fraction of the time that it takes an intermediate user;
  • The automation capability of Excel is staggering;
  • It’s not actually that hard to turn basic users into intermediate ones, and intermediate users into advanced ones, so that they can do things in a fraction of the time they currently do, if not automate it completely.

Desired state

We propose to train our analysts to become not just better Excel users, but also more effective analysts. Note that this initiative isn’t just about the use of Excel itself, but related disciplines such as effective data visualization, business process design, and logic. Given Excel is the tool by which people express their analysis, data visualization, and logic, then if we teach people to use the tool better, in doing so we will also give them some pointers in thinking harder about what they are using the tool to achieve.

The desired state that we seek to arrive at would be demonstrated by the following outcomes:

  • Our people would leverage more fully off Excel’s rich feature-set in order to achieve better analytical outcomes with much less effort. At the same time, they should be more fully cognizant of common and potentially avoidable spreadsheet design flaws and pitfalls.
  • Our people would better judge the appropriate amount of time and precision required for any given analytical task. They will be less likely to over-analyse/over-build, and more cognizant of the diminishing returns that often accompany increased complexity of approach.
  • Mission-critical spreadsheets/templates would be more robust, simpler to maintain, and user-friendly, as well as easier for successors to understand and maintain. This should result in lessened business risk, via decreased risk of incorrect models and catastrophic spreadsheet failure; Increased model auditability; and a more consistent approach to spreadsheet development and use across teams.
  • Once our people better realize the capability of the Excel application, they begin to actively look for other efficiency opportunities where they can leverage their new Excel skills, and share their approaches.

Approach

This initiative is largely focused on increasing human capital – which historically has been more the domain of the organization’s Learning and Development team rather than our own unit. However, we propose entering into this space due to the following factors –

  • Reduction of L&D’s technical training capacity;
  • The opportunity cost of not realizing some fairly low-hanging efficiency dividends;
  • The cost of procuring external training, and the risk that such training would not have the long-term positive impact on current practices that we seek;
  • The increasing time pressures and demands on staff – meaning increased barriers to utilizing external trainers from both a financial and a time perspective; and
  • The fact that we already have a strong interest in developing training materials that encompasses Excel, Modelling, VBA, and Business Process Improvement.

The primary outcomes this initiative will deliver are –

  1. Increased efficient/effective use of one of our main business productivity tools – Microsoft Excel – and greater awareness of current sub-optimal processes and approaches.
  2. Education of users to self-identify efficiency/risk issues with existing spreadsheet-based processes/approaches and give them avenues and resources to address these issues.
  3. Facilitation of increased peer-to-peer learning and peer-review opportunities between Excel users throughout the wider organization.

In doing this, the initiative will take a multi-pronged approach:

  1. Remedial mitigation of mission-critical spreadsheets/processes
  2. ‘Best Practice’ efficiency/effectiveness education
  3. Peer-to-peer user group
  4. Identification, creation, and dissemination of useful resources/templates
  5. Evaluation of additional tools/external training opportunities

These are covered in more detail below.

1. Remedial mitigation of mission-critical spreadsheets/processes.

We will work directly on selected mission-critical spreadsheets and spreadsheet-bases business processes in conjunction with business owners to identify design issues and prioritise remedial action.

2. ‘Best Practice’ efficiency/effectiveness education

We will deliver multiple training sessions/workshops on best-practices covering modelling, spreadsheet risk mitigation, and using the Excel application more effectively and efficiently. This will also draw on ‘lessons learned’ from the above step. This is critical given that several of the spreadsheets prioritized for investigation in the preceding step were constructed within the last 6 months. This highlighting that we have an on-going issue, and not just a problem with legacy spreadsheets.

Sessions will cover –

  • How recent versions of Excel have extended its capability from mere spread-sheeting into business intelligence.
  • Data organisation: Many things in Excel go from challenging to easy simply by changing how source data is organized.
  • Understanding how Excel calculates, and avoiding calculation bottlenecks and overhead by wisely choosing/using formulas for efficiency.
  • Leveraging pivot tables for aggregation and reporting; and utilising Excel’s dynamic table functionality to cut down on complexity.
  • Using advanced functionality to augment user interfaces by incorporating slicers, advanced filtering, VBA (aka macros), and dynamic SQL queries (for simplified data retrieval and processing) into spreadsheets/models.
  • Conditional formatting and data validation techniques that can help to better validate user input.
  • Tools (both free and commercial) that can help users to work more efficiently in the Excel environment.
  • Troubleshooting and streamlining existing models that users have inherited.
  • How users can get free help, advice and inputs from online resources and forums.
  • Modelling/analysis best practices.
  • Data visualization best practices.
  • Spreadsheet development best practices, including case studies covering lessons learned from recent work.

Session attendees will also have access to associated hand-outs/workbooks with supporting content and links to further in-depth resources. Each session will be repeated multiple times on a rolling basis to facilitate/encourage maximum patronage. Managers will be encouraged to actively promote attendance at these sessions and potentially include them in staff development plans if appropriate.

3. Peer-to-peer user group/help forum.

We will set up and facilitate an internal Excel User Group – potentially with a supporting software forum/message board. This will be used to –

  • Provide peer-to-peer learning and support opportunities. A wider peer-to-peer support network that extends beyond just our unit alone will provide much wider coverage than me alone can offer.
  • Identify/evaluate mission-critical spreadsheets across our unit that potentially impose significant business risk and/or administrative burden, and provide owners with some options to restructure/re-engineer them accordingly.
  • Provide attendees with more hands-on exposure to tools/tricks that they can use to re-engineer their own spreadsheets in need. Encouraging all users to utilize the skills of identified expert users on a consultancy basis for advice and peer review as needed – perhaps via the peer-to-peer-based user group outlined above.

4. Identification, creation, and dissemination of useful resources/templates

We will identify/create a useful repository of quality free training resources (including construction of additional in-house resources and ready-to-use macros/templates where warranted) – that supports further in-depth professional development and the same time reduces our dependency on paid external courses. This will draw heavily on the large amount of free resources and training materials available online that equal and in many cases surpass paid external training content in terms of providing learning outcomes.

We will publish a weekly ‘Productivity Hack’ article on the organizational intranet home page suitable for users of all levels. These articles may also reference a number of the outstanding productivity resources published each week on the Internet by the worldwide Excel Development/Training community (including blog posts, technical articles, training videos et cetera).

5. Evaluation of additional tools/external training opportunities

We will work with IT to evaluate new additions to Excel such as PowerPivot – a free extension to Excel that allows users can crunch, filter, and sort millions of records with very little overhead, as well as incorporate multiple data sources easily into PivotTable-based analysis, using an interface they are already familiar with. PowerPivot extends the capability of Excel to the point that it might reduce the need for some of the other apps we currently use to amalgamate discrete data sources, such as SAS.

We will also offer our assistance to Learning and Development to help them identify/rate any external training providers they will use going forwards.

Identifying duplicates between multiple lists

Howdy folks. Jeff here, back from my summer holiday in the Coromandel Peninsula in the North Island of New Zealand, where I’ve been staring at this for the last 21 days:
DDOE_Identifying duplicates between lists_Opoutere

For the next 344 I’ll be staring at this:
DDOE_Identifying duplicates between lists_Excel
God, it’s good to be home.

A while back I answered this thread for someone wanting to identify any duplicate values found between 4 separate lists.

The way I understood the question, if something appears in each of the four lists, the Op wanted to know about it. If an item just appeared in 3 lists but not all 4, then they didn’t want it to be picked up. And the lists themselves might have duplicates within each list.

Say we’ve got these 4 lists:
DDOE_Identifying duplicates between lists_Names

We can’t simply use Conditional Formatting, because that will include duplicate names that don’t appear in each and every column, such as ‘Mike’:
DDOE_Identifying duplicates between lists_Wrong

Rather, we only want names that appear in every column:
DDOE_Identifying duplicates between lists_Right

I wrote a routine that handled any number of lists, using two dictionaries and a bit of shuffling between them. And the routine allows users to select either a contiguous range if their lists are all in one block, or multiple non-contiguous ranges if they aren’t.

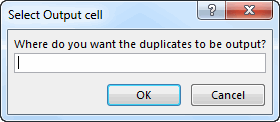
  1. The user gets prompted for the range where they want the identified duplicates to appear:
    DDOE_Identifying duplicates between lists_Select Output Range
  2.  

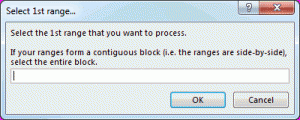
  3. Then they get prompted to select the first list. The items within that list get added to Dic_A. (If they select more than one columns, the following steps get executed automatically).
    DDOE_Identifying duplicates between lists_Select First Range
  4.  

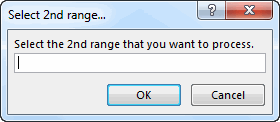
  5. Next they get prompted to select the 2nd list, at which point the code attempts to add each new item to Dic_A. If an item already exists in Dic_A then we know it’s a duplicate between lists, and so we add it to Dic_B. At the end of this, we clear Dic_A. Notice that any reference to selecting a contiguous range has been dropped from the InputBox:
    DDOE_Identifying duplicates between lists_Select 2nd range
  6.  

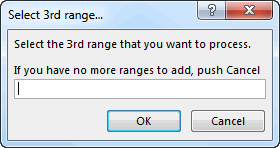
  7. When they select the 3rd list, then it attempts to add each new item to Dic_B, and if an error occurs, then we know it’s a duplicate between lists, and so we add it to Dic_A. At the end of this, we clear Dic_B. We carry on in this manner until the user pushes Cancel (and notice now that the InputBox message tells them to push cancel when they’re done):
    DDOE_Identifying duplicates between lists_Select 3rd range
  8.  

Pretty simple: just one input box, an intentional infinite loop, and two dictionaries that take turns holding the current list of dictionaries. Hours of fun.

Only problem is, I had forgotten to account for the fact that there might be duplicates within a list. The old code would have misinterpreted these duplicates as between-list duplicates, rather than within-list duplicates. The Op is probably completely unaware, and probably regularly bets the entire future of his country’s economy based on my bad code. Oops.

I’ve subsequently added another step where a 3rd dictionary is used to dedup the items in the list currently being processed. Here’s the revised code. My favorite line is the Do Until “Hell” = “Freezes Over” one.

What ever you do, don’t sign up to Twoo

Hi all. Jeff here. Sorry, not an Excel post, but a warning to steer clear of email invitations from people you know to join something called ‘Twoo’. If you get an email saying “Joe Bloggs left a message for you”, then burn it. I foolishly didn’t, and clicked the link from an excel contact, Joe Bloggs…despite thinking aloud “Why the heck doesn’t Joe Bloggs just email my gmail account direct”. I then foolishly gave this service access to my gmail contacts, and next thing I know it spammed a whole bunch of my contacts (including some other email addresses I use) saying that “Jeff has sent you a message via Twoo”

Makes my blood boil…both their gall and my stupidity.

Read more at http://techcrunch.com/2013/08/03/a-year-of-spam-twoo/