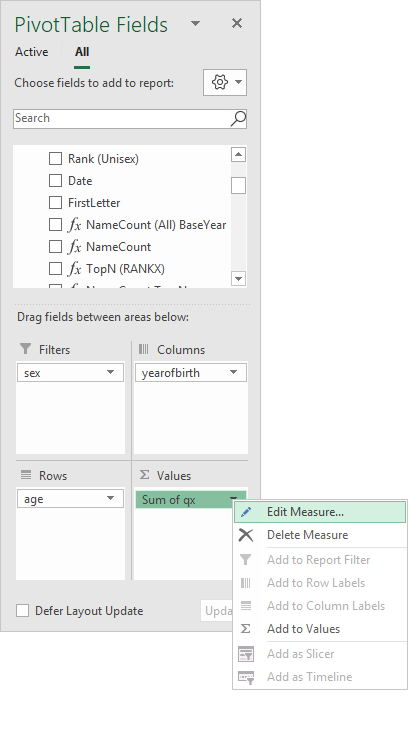
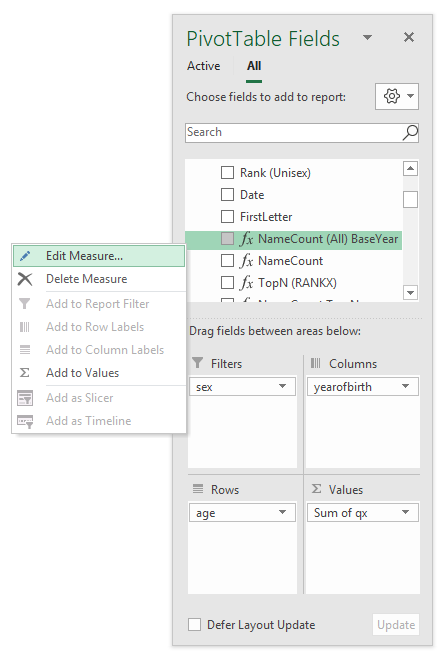
Where’s my “Edit Measure” option from the Values pane?

Why is it that I can do this from here


…but it doesn’t let me do this from there?

When I want to edit a PowerPivot measure, I generally want to edit a measure I’m *already* using.  I don’t want to scroll through a whole bunch of tables in the fields list or the Manage Measures dialog trying to find it. I just want to right-click on that Measure right there, that’s staring back at me from the PivotTable Fields Values Pane.

Yes, I’ve added an idea on UserVoice for this. It languishes somewhat behind Ken Puls’ great idea to radically improve the layout of this part of the PivotTable Fields List.  Which languishes in turn behind Zac Barresse’s no-brainer suggestion that Microsoft allow users to use Tables that are on otherwise-protected sheets.

Honestly, I think the Excel UserVoice site is the Microsoft equivalent of this ‘nifty’ feature in my other most widely used application:

I did tweet this from my new social media experiment@InsightsMachine but I think all 8 of my followers are my mother. If you have followers that aren’t your mother, please retweet this.

Australia Summit for Microsoft Business Applications. (Oh, and Excel)

Excel occupies a special place in my heart. It also occupies a special place in the Power universe thanks to the superpowers (DAX and PowerQuery) it shares with its alter-ego PowerBI. Unfortunately this Power Universe is a lot like the Marvel one: An ever-expanding cast of new players with sometimes overlapping powers constantly has me saying “Wait, what?” Characters like Flow and PowerApps among others. Where did they come from? What are their powers? How do they fit into this picture?

Which is why I’m planning on attending the Australia Summit for Microsoft Business Applications in Melbourne from 21st-23rd August. Even though it’s 2,571 km from Wellington. Even though I have to get up at 4am to catch a 6am flight to it. Even though I won’t get to go to work for a few days.

If you live in Australia or New Zealand, you should check out the content on offer for the ‘Power Platform’ track: There is a tonne of presentations that are directly relevant to DAX and PowerQuery for starters. Which means they are directly relevant to Excel Developers too. Particularly so if you’ve come to the conclusion that the only good formula is a DAX formula; and that the argument between VLOOKUP and INDEX/MATCH – or even between Option Explicit vs “ ” – are now pretty much irrelevant, given what we should instead be fighting about is “Should I handle this with PowerQuery, or PowerPivot?”

There’s also a lot of content pitched at Citizen Developers. Citizen what? Well, the Power universe is expanding so fast that Microsoft have decided to let anybody who knows how to drive a mouse program these tools. Granted, not all of us can. Yes, maybe they’re overselling it. But if so, organizations are certainly overbuying, meaning there is a ton of opportunity out there for anyone who can talk the talk, even if they’re still learning to walk the walk.

This conference is a great place to get up to speed on what’s going on in the wider realm that Excel inhabits. But the problem with any conference is scheduling clashes. Sticking with my movie analogy a little longer, it’s like the annual Wellington International Film Festival: It comes around once per year; I always have great intentions to map out my viewing ahead of time when flicking through the glossy programme, but everything I’m interested in seems to be on at the exact same time. Meaning paralyzing indecision and crushing FOMO.

But not this time. This time I have a plan. This time I have carefully studied every presentation outline, and scored each based on a highly scientific method in order to optimize my learning given the inevitable scheduling clashes. And I’m gonna share it with you, in case you want to tag along and sit beside me right at the front center. (Best place to sit. Most of these presenters can’t throw a free T-shirt for crap).

Wednesday 21 August

Creating and Managing a Power BI Enterprise Deployment (Craig Bryden). Why: Craig came to my house last time he was in Wellington. I liked his music. He liked my beer. I need to find out where he’s staying so he can like my music and I can like his beer.

Many to Many and Weak Relationships in Power BI (Matt Allington). Why: I’ve had many weak relationships over the years, and a complete absence of many to many ones. I’ve simply got to find out where I’m going wrong.

Build Flows Like a Coder Without Knowing How to Code (Leon Tribe). Why: I’m clueless. And lazy. And want to embellish my CV.

Thursday 22 August

Using Microsoft Flow as a middleware to turbo-boost PowerBI (John Liu). Why: The title reminds me of Knight Rider. That said, I like the sound of The Shortfall of Microsoft Flow and the Solution No One Talks About (Aung Khaing). So tough choice, but I’ll probably just go with whatever presenter looks most like David Hasselhoff.

Fifteen Examples how Power BI is enabling Local Government to become data-driven (Warren Dean). Why: It’s about the city of Casey. I went to school with Casey. He could hardly find his own house. I never dreamed he would go on to found a city.

Top 5 DAX Tricks for Super Effective Power BI Dashboards (Andrej Lapajne) Why: Zebra BI take their dashboard visualisation principles seriously. And I’m serious about DataViz. That said, I’m also keen on Solving Business Problems with DAX (Darren Gosbell), because I live for examples and problems, having been one and/or the other many times over.

Friday 23 August

Debugging Power BI Performance Issues (Darren Gosbell) Why: I’ve had performance issues in the past. Ask anyone. Mind you, Darren is on at the same time as Bhavik Merchant from Microsoft, who’s giving us Power BI Performance Tuning: What, Why and When? They should make these guys do a performance-off.

Unleash Row Level Security Patterns in Power BI (Reza Rad) Why: Because I’m insecure and prone to oversharing.

Learning M from the UI (Matt Allington) Why: I want to see what M stands for, and what it has to do with Unemployment Insurance.

Advanced Analytics Methods To Uncover Hidden Gems in Your Data (Martin Kratky) Why: Because I’m constantly regressing (I’d go to see Phil Seamark talk about The Art of Data Modelling with Analysis Services, but he runs the Wellington PowerBI User Group with me, so I’ll just make him give the presentation there, while I scarf free Pizza).

So, that’s my highly scientific method. And I think it’s as good a method as any.

Mind you, there’s a hell of a lot of other great looking presentations with less funny titles that I’m bypassing. Again, check out the Power Platform track on the website, or alternately click here for a handy Word doc I compiled contains the presentation outlines of a whole bunch of sessions that I’d recommend might be of interest to Excel folk.

Love to see you there.
Office 365 Pro Plus meets Windows 10S, they don’t fall in love.

I recently purchased a couple of Surface Laptops, that run Windows 10S. I went to install a couple of my Office 365 Pro Plus licenses on them. Now I’m wondering what that S stands for (apart from ‘Security’), after coming up against these three immutable laws:

  • If you’ve got Windows 10S, you can only install apps from the Office Store. Okay…
  • If you’ve got an Office 365 Pro Plus subscription, you can install Office 365 Pro Plus on up to 5 devices that are “compatible with Windows 7 or later”. Yipee!
  • Office 365 Pro Plus is not available via the Office Store. What the!

Well that’s just plain Windows 10Stupid. Can someone from the Windows Store team explain that to someone from the Office Marketing team, so they can add “…unless you have Windows 10S” to their Office 365 Pro Plus copy, please?

Note that you can ‘upgrade’ your Windows 10S devices to a non 10S version that lets your kids download viruses unassisted. But unless you’re willing to open that Pandora’s Box, Microsoft effectively stymie you from installing their own software on their own operating system. Nuts. Absolute nuts.

Ah well. In other Office 365 world news:

That is, unless they have Windows 10S and an Office 365 Pro Plus subscription, it seems.

Seven steps to (almost) protected Calculated Columns

Earlier I complained about how you can’t lock down Calculated Columns in Tables, while still allowing users to insert new rows. Dick gave me half a hack in the comments of that post, and I’ve come up with the other half to give you an almost-foolproof way to protect those precious Calculated Columns from your almost fools.

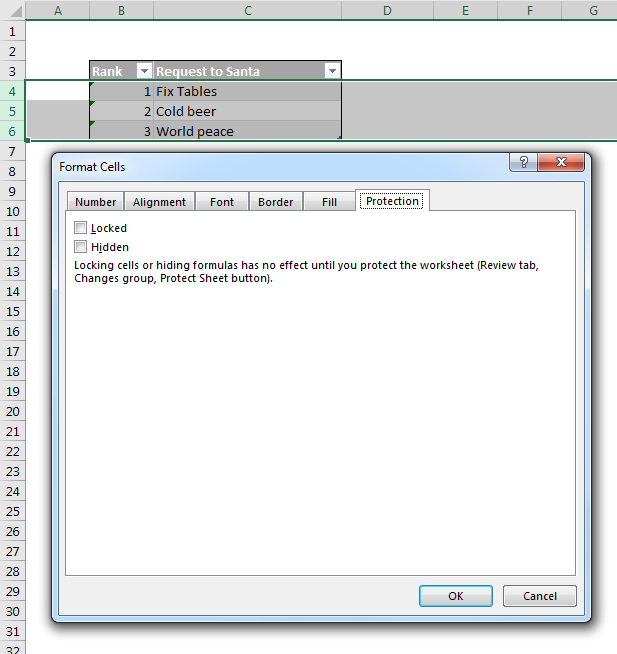
Step 1: Unprotect the entire rows that your Table occupies.

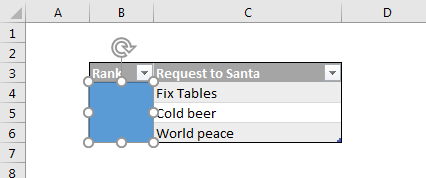
Step 2: Park a shape over the Calculated Column. Leave it’s protection as the default ‘Locked’. This will act as a shield once the sheet is protected.

Step 3: Format the shape so that it has no border, and a white fill that is 99% transparent. (If it’s 100% transparent, then Excel will let users click right through it, to the cells behind).

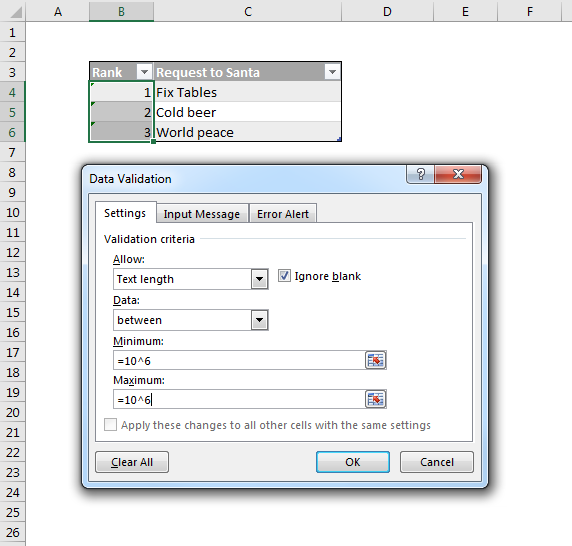
Step 4: Add some DV that stops users from changing the formula in the column, should they navigate around the shape shield via using the arrow keys. Dick’s formula below ensures that someone will have to spend an awful long time typing before they are allowed to overwrite the existing formula.

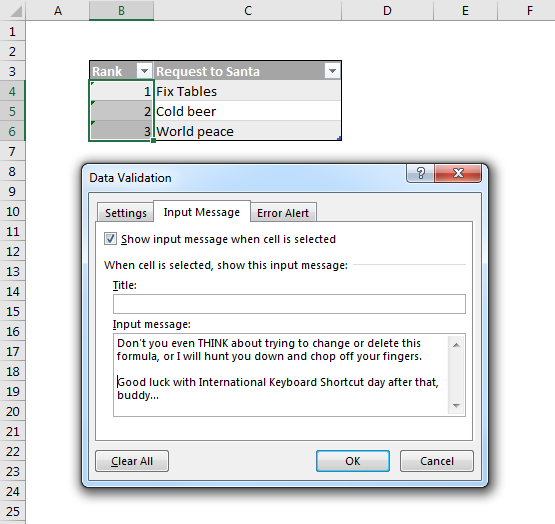
Step 5: Add a pop-up input message that politely warns them not to mess with your calculated column, should they manage to reach it using the arrow keys. This is still needed, because while they can’t change the formula, they can still clear it using the Delete key.

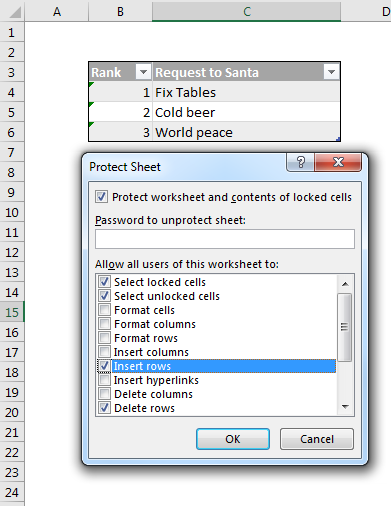
Step 6: Protect your worksheet in a manner that allows row insertions/deletions.

Step 7: Go vote for Zach Barresse’s UserVoice request for Microsoft to fix Tables so that you don’t have to use 6 hacks to work around their “feature”.

This works a treat: Try as they might, they can’t select the unprotected cells in the Calculated Column by clicking on them. If they click in the bordering cells and use the arrow keys to navigate behind the shield, they get warned off politely:


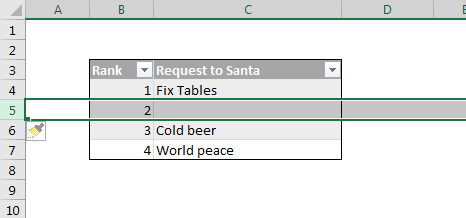
…and yet they can still insert new rows:

…and as you can see, the unprotected formula in the calculated column copies down just fine.

Identifying PivotTable Collisions

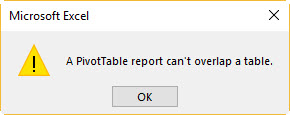
So you’ve got a file with dozens of PivotTables in it. One day you hit Refresh All, only to see this complaint:

…or perhaps this variant:

What’s happened is that the size of the PivotTable has increased, and the PivotTable is now trying to occupy space where another Pivot or Excel Table already lives. So you know what has gone wrong. But you have no idea where. You’re either going to need to eyeball each and every bit of each and every worksheet (including the hidden ones), or you’re going to have to run a bit of code. Something like this:

…which does this:

A (refactored) Christmas Carol

Our story begins on a cold and bleak desktop. Excel, an aged application , ignores an invitation to Christmas dinner from his nephew UserVoice. Excel turns away desperate pleas from 222 voters who seek an upgrade to Tables in order to provide data integrity and usability for their poor users. Excel only grudgingly allows his overworked, underpaid Tables to be used while a sheet is protected, and even then, only to conform to the bare minimum of the existing Sheet Protection functionality.

At home that night, Excel is visited by Lotus 1-2-3’s ghost, who wanders the Earth, entwined by heavy patents and dependency chains forged during a lifetime of greed and selfishness. Lotus 1-2-3 tells Excel that it has one chance to avoid the same fate: Excel will be visited by three spirits and he must listen to them or be cursed to carry dependency chains of his own, much longer than Lotus 1-2-3’s chains.

The first of the spirits, The Ghost of Microsoft Past, takes Excel to scenes of Excel’s boyhood and youth, reminding him of a time when he was more innocent. The boyhood scenes portray Excel’s lonely childhood, his relationship with his beloved sister Word, and an office party hosted by his first employer, Mr. Gates, who treated Excel like a son. They also portray Excel’s neglected fiancée Access, who ends their relationship after she realizes that Excel will never love her as much as he loves unstructured data.

The second spirit, the Ghost of Microsoft Present, takes Excel to a joy-filled help forum of people gathering the makings of a PowerQuery, and then on to a celebration of business intelligence in a data-miner’s PowerPivot data model. They then visit Acme Inc, where we meet Jolly Jeff, an otherwise happy analyst who’s Table-driven macro-free Excel templates are seriously unprotected. The spirit informs Excel that Jolly Jeff’s carefully constructed templates will soon be corrupted by ignorance and laziness unless the course of events changes. Before disappearing, the spirit shows Excel two hideous, emaciated columns of data named Calculated_Column and Freetext. He tells Excel to beware the former above all and mocks Excel’s complete lack of concern for their unprotected state.

The third spirit, the Ghost of Microsoft Yet to Come, shows Excel a business office in the future. The ghost shows him scenes involving the death of a disliked application. The application’s funeral will only be attended by local businessmen if donuts (of the charting variety) are provided. When Excel asks the ghost to show anyone who feels any emotion over the application’s death, the ghost can only show him the pleasure of Stephen Few. The ghost then shows Excel the application’s neglected grave:

Excel: 1985 – 365.
Here lies one who frivolously cavorted with the entire office while not using adequate protection.
Recalculate AND Die.

Sobbing, Excel pledges to the ghost that he will change his Table Protection to avoid this outcome. Excel awakens the next day a changed program. Excel spends the day with Mr Gates’ family and anonymously sends a large update to Tables to the Weir home for Christmas dinner. From then on Excel began to treat everyone who uses Tables in a protected workbook with kindness, generosity and compassion, embodying the spirit of User Experience.

What I want for Christmas

…is for Microsoft to fix how Sheet Protection and Tables interact. I want it more than world peace. I even want it more than cold beer. See…I even put it on my Christmas wish list:

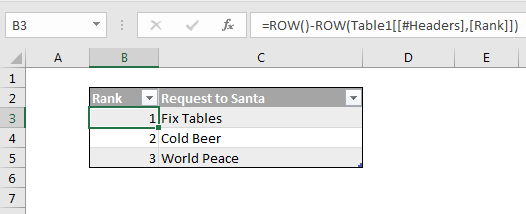
What am I talking about? That template above is a great example: Let’s say I want to send you all some templates for you to fill out and send back. Being a prudent developer, I’ll use Excel Tables, and those tables will have a mixture of Calculated Columns with the formulas locked down (because I don’t trust you one bit), and free-text fields (because I want you to think that I care about what you have to say).

That’s what I’ve done above: I’ve got a RANK column that automatically assigns an incrementing integer to each entry, and I’ve got a freetext field where you can put your own requests, if for some reason you don’t share my world view. And I also want to let you insert additional columns, in case you want more than three things.

I better push Ctrl + F1 to bring up the Format Cell dialog, and make sure those genius formulas in that Calculated Column will be protected when the sheet is locked:

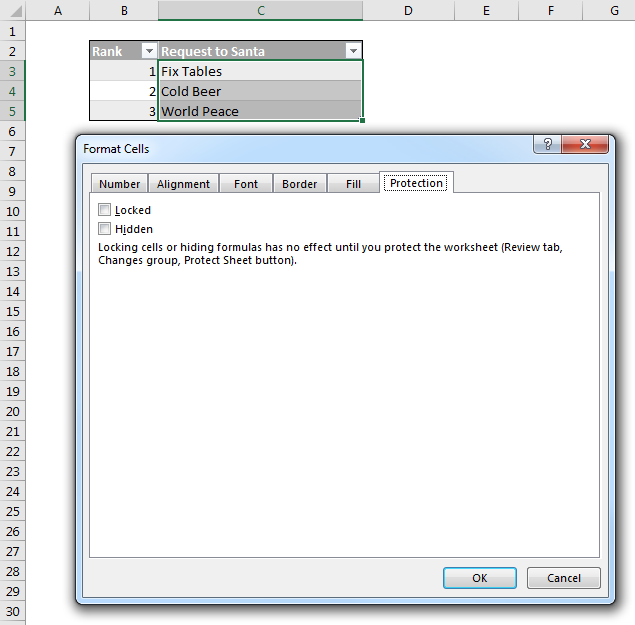
…and I better make sure that the ‘Request to Santa’ column is NOT protected:

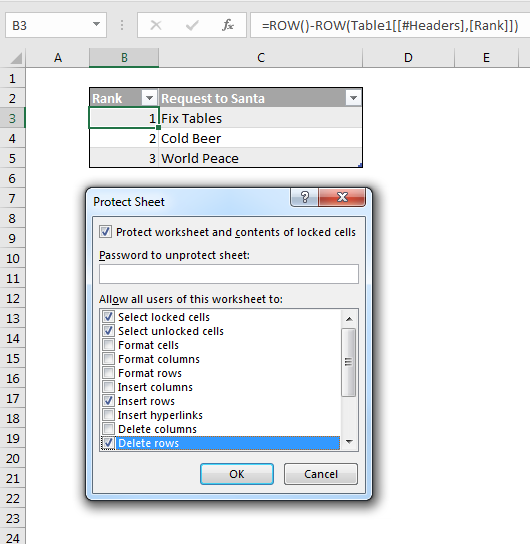
Awesome…all I need to do in order to activate this protection is to lock the sheet, while still allowing row inserts and deletes:

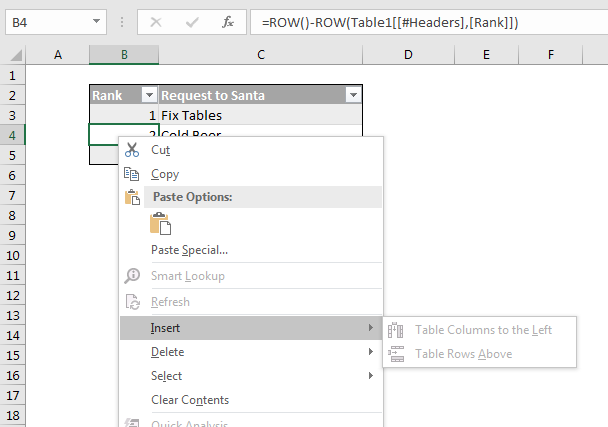
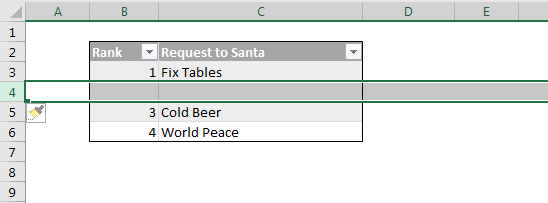
And all is good, until some moron decides that Cold Beer comes in a distant third behind some additional thing they would like to add to this Christmas wish-list, like “New President”. So they right-click within the Table Row while Tra-la-laa-ing, only to be stopped mid laa: the Insert > Table Rows Above option is greyed out. :-(

But being persistent, they decide to force the issue by selecting the entire row, and then right clicking. And indeed, this time they encouragingly see that indeed the Insert New President… option is still available to them:

…only to find that Excel has trumped their desire:

But weirdly, when they click OK, Excel decides that it can in fact do it, kinda:

It begrudgingly inserted the new row, but it didn’t autofill the formula in the protected column. Meaning while our hapless agitator can fill out the freetext field with their new second-greatest wish, they can’t rank it. Meaning Santa might simply ignore it as invalid input:

God forbid they would want to do something equally trivial, such as extend the Table by either trying to type underneath it, or by selecting the bottom right cell and pushing Tab or Enter, because that accomplishes nada. As does Sorting and a myriad of other things that the Protect Sheet dialog swears it will let you do.

I just cannot fathom why this bug hasn’t been fixed. I recall Zack Barrasse talking about it years ago, along with some other stuff he’s mentioned on the Excel UserVoice site. Sure, I could write some VBA to add a custom ‘Insert Row’ entry to the right click menu, but I try to keep my templates macro-free as much as possible. Some absolutely need to be macro free. And I wouldn’t need macros anyhow if this functionality actually did what it says right there on the box.

Please go vote for this. And Microsoft, please go fix it…It’s got 191 votes already, and counting. And it is just sooo broken.

Inconsistent ListRow Copy

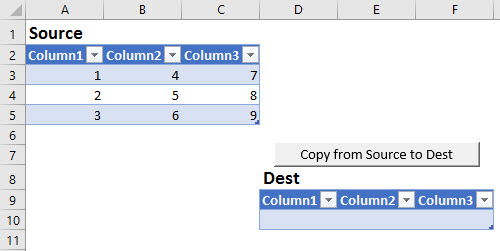
Here’s a cautionary tale for you. Let’s say you want to let users copy rows from a Source table row by row to a Dest table, by pushing a button:

…so you whip up a bit of code like this, and assign it to that button:

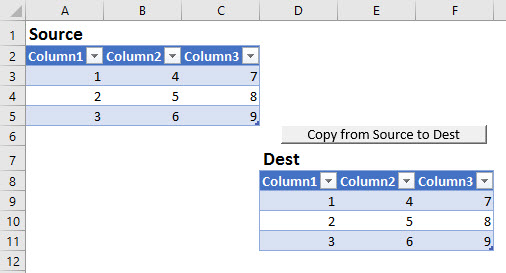
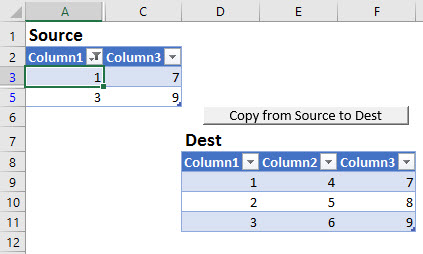
And when you run it, it works just fine:

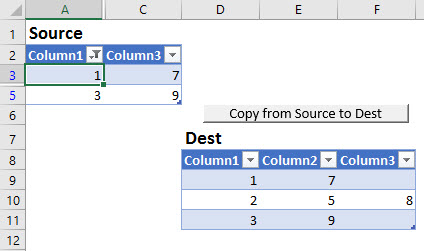
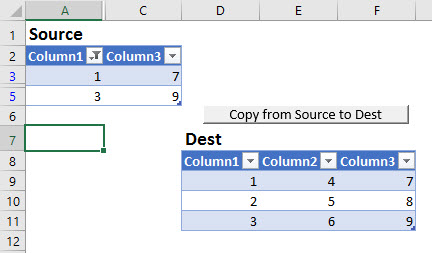
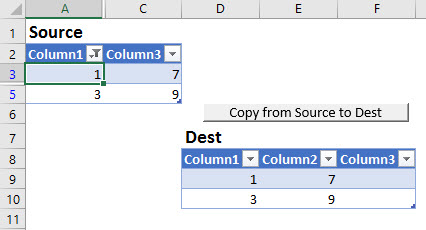
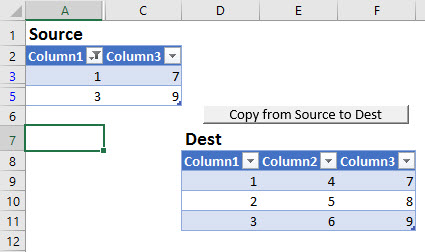
…until that is, someone hides an entire column in the source table, sets a filter that similarly hides some rows, and leaves a cell in that Table selected before running the code again, in which case you get this:

As you can see from the above:

  • For any ListRows in your source that happen to be visible, only the cells from the visible columns get copied, to a contiguous block in the Dest table, but
  • For hidden ListRows, all cells get copied

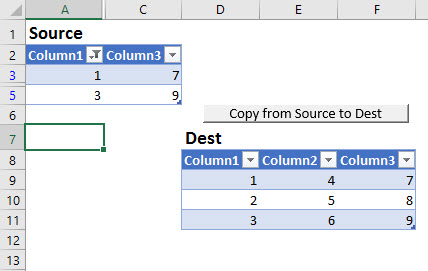
Add to this the fact that everything works just fine if the user happened to select a cell outside the table before triggering the code:

…and you’ve got the makings of a hard-to-diagnose bug that will eat up hours of your time trying to replicate.

The fix? Don’t use the .copy method. Just set the values of the second range directly to the values of the first:

…which works fine, and is faster anyhow:

In case you’re wondering what happens if you bring the whole DataBodyRange through from the Source Table using that dangerous .Copy method i.e using code like this:

…then again the results depend on whether a cell is selected in the Source table:

…or not:

Again, avoid the inconsistency by setting the values of the second range directly to the values of the first:

…which works fine, fast:

Here’s a sample file:LRCopy Test