There is an office pool for the MLB post season that goes like this: Each participant is assigned a half inning per game in the ALCS, NLCS, and World Series. A participant may get the top of the 1st in one game and the bottom of the 6th in another game. There are 20 participants for each half of 10 innings and innings after 10 roll around to the beginning. Every run scored in an inning assigned to you earns you a point.
The challenge is to distribute the innings among the participants. If you always get the bottom of the 10th (an inning that’s rarely played for you non-sportsballers), you wouldn’t fair very well. But what other innings are traditionally good or bad? Is the first inning littered with runs while the fourth is sparse? I couldn’t find any historical data online, but I do have the results of a pool from last season.
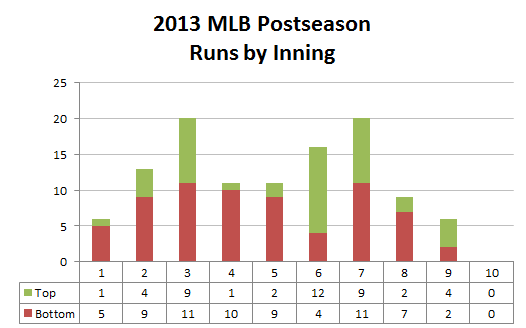
Based on this data, I don’t think one post season (21 games) is enough. Why would innings 3, 6, and 7 be higher? Why would the bottom of the innings total 68 runs, 24 more than the top of the innings cumulative 44 runs?
I thought I could assign some sort of value to each half inning, then make sure that each participant got roughly the same value. But I didn’t expect such disparity in innings nor in top/bottoms, so I’m not sure that works. I think I’ll end up making sure everyone gets the 10th inning once, then an even distribution between 1-3, 4-6, and 7-9. And if someone gets the bottom of the 9th more than once, bad luck for him.
It actually makes perfect sense why innings 3, 6, and 7 would be higher. Although I do agree the sampling isn’t enough to base any trends on.
Inning 3ish is usually after the lineup has been to bat once through and there is a slight improvement to hitting once the batter has seen a pitcher once. Additionally, a “decent” start for a starting pitcher has him coming out around the 6th or 7th inning, so as fatigue sets in (along with more trips through the batting order) run production increases in these innings.
Sure, it’s a small sample, but I could see reasons for many of the differences.
For the bottom total being higher, it’s likely because it’s the home team.
For the 3rd inning bump, it’s typically in that inning that the starting pitcher starts facing the batter for a second time.
For the 6th or 7th inning bump, the starting pitcher would typically be more tired or you would have your mop-up relief pitchers.
Seb
You guys are smart. Those are pretty good reasons.
re: “I couldn’t find any historical data online”.
natch – MLB would never allow that info to leak out.
I’ll bet they would charge a fortune for it.
I’d also like to see the same inning profile for Home Runs.
Now that would be interesting.
There’s too little data to determine via ANOVA whether the differences are significant or not.
Your post reminds me of the 538 blog – http://fivethirtyeight.com/. For those who aren’t familiar, it’s a prolific site with statistical analysis of sports, political polling and other topics like how many people pee in the shower. I’m addicted to it.
I’m enabled in my 538 habit by Feedly, my new favorite RSS tracker, and GReader a way nice Android app for reading all my Feedly content (I’m not affiliated with any of these sites or products, though I wish I were).
http://www.baseball-reference.com/ has the box scores for all games (regular and post season) going back as far as you would like.
Dick,
For post season specifically goto: http://www.baseball-reference.com/postseason/
The site also gives you the ability to export their tables via CSV or other means. Sometimes the data is text only (like box scores), but as far as pure data goes, this site is amazing. They cover just about every major sport to, should you be a fan of other sports/teams.
As an avid sports fan (born and raised in Pittsburgh), and stats junkie (I personally track all Pittsburgh Sports Team stats), this family of online sports databases is exceptional especially for raw or basic data.
It can be, and often is, a lot of link clicking and manual labor for those of us who crave efficiency, but if you don’t mind taking your old-school data pick axe and mining the site(s), you will get all the historical data you may need and then some. I’m almost tempted to do this myself…
Cheers,
-Scott
That’s exactly what I need Scott. For some reason I can’t read that site from Excel, using XMLHTTP. The ReadyState never changes from 1 like the page won’t finish loading.
Dick,
That site can be a bit squirrelly when trying to view sit traight from Excel. Sometimes you have to go “Old School, brute force” and manually enter the data. On this family of sports reference websites, if you lookup individual player statistics, the website is much more cooperative with their export features. I am lucky to have dual monitors to have one used for the website and the other Excel, and manually enter the data I can’t automate over to Excel. I hope you were able to get the results you needed, regardless of the method(s) used. Cheers!
-Scott
Baseball-reference.com has this sort of report already: http://www.baseball-reference.com/play-index/inning_summary.cgi?year=2014&team_id=ANY&submitter=1 (2014 for the regular season). Spoiler alert: worst runs per innings are 2nd (when pitchers are likely to be at bat), 8th and 9th (when the best relievers are likely to pitch, and 3rd (see 2nd inning, only less so), and 7th (see 8th inning, only less so).
And one other thing that wasn’t touched on is the stats in the 9th inning. The only time a game goes to the bottom of the 9th inning is when the home team is losing. So typically the lead may be too much to overcome and would end up losing anyways. The away team ALWAYS gets to bat, as the home team does not.
Thanks Tim. That’s just what I expected – not much difference (at least for my purposes). .63 runs per inning in the 14th?