Analyze data with Excel on the web
Microsoft has introduced a new web based capability that extends its Excel Services offering. This new capability provides a limited interactive view of any table in a web page.
An introduction to this service is below. For those interested in additional capabilities and more advanced and useful capabilities see:
For the consumer:
Learn more about Interactive View
Analyze a table in any web page with a dynamic interactive view
For the developer:
Implement the Interactive View feature for 1 table
Implement the Interactive View feature for multiple tables
Improve the formatting and layout of the 'Interactive View' buttons
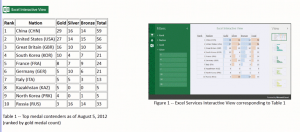
As an example, the image below shows a table, the Interactive View button, and the result.

For a live demo, developer tips, and more, please see http://www.tushar-mehta.com/publish_train/data_visualization/15c%20interactiveview/index.htm
I would like to ask, if it is possibility to add some more additional attributes in Excel Interactive View button command list. I would like to have some kind of a table like this one
Indicator Year
2009 2010 2011 2012
Population
Male
Female
Mortality
and make filter just for “Year”, I mean, that it would be a possibility to choose year: just 2010 or 2012 or all of its. Now Interactive View button make all columns like filters (Year1, Year2, …) and let me pick particular value of year. I don’t need to choose value in filtered year, I just need to select specific year. Is it possibility to do with this Interactive View Button? At first I found this Button I was surprised and happy, but when trying to do I really need, something went wrong… Maybe it is some other possibility to do like this? I would appreciate for You help!