Angled Column Heading

Every time it comes to Column Headings I struggle to get meaningful text into such a small box.

There are a few approaches I’ve used:

  • Widen this Column just for sake of the heading
  • Double the Row Height, widen the Column a bit then Word Wrap
  • Widen the Column just enough to let Shrink To Fit do the rest
  • Abbreviate the heading, put the long version in a cell comment
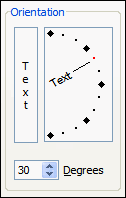
  • A little while ago I starting rotating the Column Heading text as a way to save space…

  • 90° Text Orientation – get the column as narrow as possible
  • I’ve settled on a less extreme Text Orientation, like 30°.

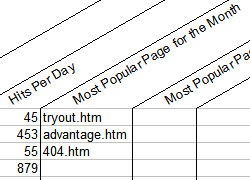
    But what is really great about Text Orientation is the way Vertical Borders react – they go angled too!

    I think the borders really help to guide a user from the column heading the column values.

    It would be interesting to know what you do when it comes to formatting headings… Click Comments and let us know!

    Two Type Charting

    Excel provides some nice Charting features. One really nice feature is the ability to combine chart types.
    Here’s how to graph KPI data together with both a line and column chart.

    You will need the Charting toolbar for some of it. Right-click the toolbar and select Chart.

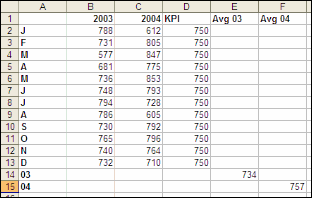
    I’ll start off with some monthly data for the last two years.

    E14 and F15 are =AVERAGE(B2:B13) and =AVERAGE(C2:C13) respectively.

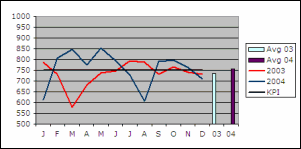
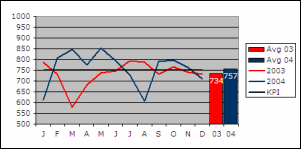
    Highlight A1:F15 and use the Chart Wizard to create a simple line chart without markers.
    Because Avg 03 and Avg 04 have only one value, they cant be seen in a line chart.
    From the Charting toolbar, use the dropdown box to select Series “Avg 03?. Then from the Chart menu, select Chart Type. Set it to a Column chart.
    The same needs to be done for Avg 04.

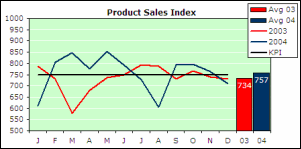
    I’ve set 2003 to Red, 2004 to Dark Teal, and KPI to Black. All three with a weight of 2.
    The Scale I set to Min:500, Max:1000, Maj:50, Min:50, Axis Crosses:500.

    Doubleclick the Avg 03 bar to set formatting options.
    Pattern:Red, Data label:Value=Ticked, Options: Overlap=100, Gap=5
    For Avg 04… Pattern:Dark Teal, Data label:Value=Ticked

    Doubleclick the number appearing over each bar to set formatting options.
    Font:White, Alignment:Label Position=Inside End

    I then did some general tidy up with the Plot Area.
    I made it bigger and set the Background to Light Green, Gridlines White

    Searching Files in Subfolders for VBA code string

    We have an unwritten rule where I work which goes: No major changes on a Friday!

    Being a Friday (NZDT), it was a good day for housekeeping the systems I look after.

    There were a few database Views which I’ve been wanting to tidy up. These particular Views kind of got “out of control” so I had to hunt down all the places where they were used.
    Unfortunately, the locations were never registered.

    Fortunately, it’s use was limited to ADO calls from within Excel code modules. All of the files were in the same Folder – buried under several layers of subfolders.

    Here is a bit of code which opens each XL file in a folder (and subfolders), checks each code module for a string and when found reports: FileName, ModuleName, LineNumber

    Bulk Uploads using ADO Command Parameters

    I’ve been doing some stuff with SQL Server just recently – first time ever. Its been a bit of a shock really. I’m strictly an Oracle guy so I’ve been careful to keep an open mind. It took me a long time to work out how to create an outer join! My task has been to pull data from SQL Server, manipulate it then send it on to an Oracle database. Excel fits nicely between.

    Here’s a little sample I’ve written for MS Access to demonstrate my approach. In Access I’ve got a two column table called Employee. Columns EmployeeID and EmployeeName. My Excel Worksheet has two columns EmployeeID and EmployeeName with a column Header in Row 1.

    Be sure to read the comments to this post – I’ll write the reasons behind my approach and code.

    For Next Behaviour

    Quite often I’ve come across Excel Newsgroup posts where the poster stores the range in a variable before doing For Next.

    Sub test1()
        Dim rng As Range, rngFull As Range
     
        Set rngFull = Range(Range(“A1”), Cells(Rows.Count, “A”).End(xlUp)) ‘Store this
       For Each rng In rngFull
            Debug.Print rng.Address
        Next
    End Sub

    They could have written

        For Each rng In Range(Range(“A1”), Cells(Rows.Count, “A”).End(xlUp))

    but they didn’t… and that got me wondering.
    I thought “hey, maybe it gets calculated every loop”
    I thought “for a column containing 1,000 entries, that would be an enormous performance drain!”

    Well… call me Henny Penny… I started storing range calcs in variables before loops too and I have been for ages – until today.

    It turns out that VB is well behaved – it’ll only run the calc once. This block of code confirms it.

    Sub test2()
        Dim i As Long, rng As Range
     
        For i = 1 To getval
            Debug.Print i
        Next
     
        For Each rng In getrange
            Debug.Print rng.Address
        Next
    End Sub
     
    Function getval() As Long
        MsgBox “getval called”
        getval = 5
    End Function
     
    Function getrange() As Range
        MsgBox “getrange called”
        Set getrange = Range(“A1:A5”)
    End Function

    That’ll teach me to make assumptions.

    Range Areas

    When you need to work with ranges that are not connected (contiguous), use the Areas collection.

    A Range contains an Areas collection containing one or more Ranges.
    Most commonly it’s a Selection containing Areas.

    Selected Areas

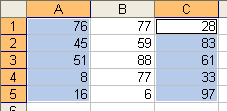
    Hold down the Control key and select cells A1:A5 and C1:C5
    The highlighted cells are represented by the Selection object.
    The Selection object has an Areas collection.
    Item 1 of Areas is the range A1:A5
    Item 2 of Areas is the range C1:C5

    Because items of Areas are just Ranges, you can do operations like:

    Selection.Areas(2).Font.Bold = True

    One of the common uses of Areas is the Worksheet SelectionChange event.
    The user can create any sort of Selection so handling Areas is a good idea.

    This example writes to the status bar as you select cells.

    Private Sub Worksheet_SelectionChange(ByVal Target As Range)
        Dim str As String, rng As Range
     
        For Each rng In Target.Areas
            str = str & IIf(str = “”, “”, “, “) & rng.Address(False, False)
        Next
     
        Application.StatusBar = “Selected Areas: “ & str
    End Sub

    To create a range with Areas, use Union.
    When you Union two ranges together, a range is returned which contains an Areas collection with two range items.

    Sub test()
        Dim rng1 As Range, rng2 As Range, rngSuper As Range
     
        Set rng1 = Range(“A1:A5”)
        Set rng2 = Range(“C1:C5”)
     
        Set rngSuper = Union(rng1, rng2)
     
        MsgBox rngSuper.Areas.Count
    End Sub

    Exception: If the Union ranges create a contiguous range it gets treated as a single Area.
    Try the code but instead of C1:C5 use B1:B5

    Union and Intersect

    A couple of rarely used features of worksheet formulas are Unions and Intersects.

    Unions
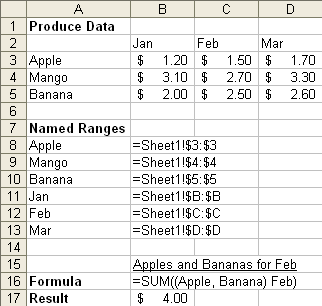
    Most Excel users have probably have come across Union – the combination of ranges to be treated as one range. eg. =SUM(A1, A5:A11, C10)
    If you start by typing the formula =SUM( then hold down CTRL and select ranges, Excel automatically defines a Union for you.
    The ranges are separated by a comma. The comma is referred to as a Union operator.

    I’ve seen Unions used for a Grand Total by summing Sub Totals

    Intersects
    Just like the Union operator is a comma, the Intersect operator is a space.
    When you separate ranges with a space then the range used is where they intersect. eg. =A1:C1 B1:B3 will return the same result as =B1

    I’ve never seen Intersects used in the wild. I’ve only recently discovered it myself.

    Union and Intersect Example

    It’s interesting to note that in this sample changing Feb to Jan =SUM((Apple, Banana) Jan) does not result in a Circular Reference.

    Surface Chart 3D Terrain Generator

    As a teenager I owned an Amiga 500 – that’s actually how I started (seriously) programming. Oh, the Motorola 68000 CPU was just great to write code on.
    One of the neat things about the Amiga community were the “demos” that would come out. Demos are like a music video for your computer with emphasis on creating real-time graphic effects.
    They were all about pushing the boundaries of what the architecture could achieve – quite a lot like the Excel community really.

    One of the demos that really stuck in my head was a fractal landscape / terrain generator. I was fascinated that a computer could draw realistic mountains.
    I’ve always wanted to make one – just for fun – so recently I set about learning how.
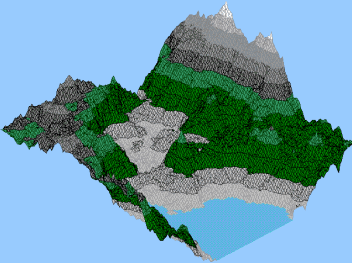
    It came as a surprise when I discovered that a terrain generator could be developed using only worksheet functions and a Surface Chart.

    Here is a sample picture. It’s actually a Surface Chart! Every time you press F9 a new picture is generated.
    3D Terrain

    You can download it from my website:
    http://www.vangelder.co.nz/excel/