Chart control – Using the Spreadsheet control as data source
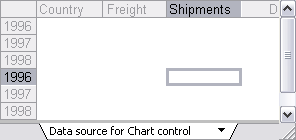
Speaking about the Spreadsheet control, I received an e-mail from an alias (?) asking how to customize the column- and rowheadings. Below is a snipped code that shows how to do it:
Dim stYears(0 To 2) As String
Dim iCounter As Integer
stYears(0) = “1996”
stYears(1) = “1997”
stYears(2) = “1998”
Set Spread = Me.Spreadsheet1
With Spread
.Height = 3540
.Width = 4695
With .ActiveWindow
‘Set the caption of the actual columnheadings.
.ColumnHeadings(1).Caption = “Country “
.ColumnHeadings(2).Caption = “Freight “
.ColumnHeadings(3).Caption = “Shipments “
‘Set the caption of the actual rowheadings.
For iCounter = 0 To 2
.RowHeadings(iCounter + 1).Caption = stYears(iCounter)
.RowHeadings(iCounter + 4).Caption = stYears(iCounter)
Next iCounter
‘Limit the viewable part of the worksheet.
.ViewableRange = “A1:D6”
End With
End With
Set Spread = Nothing
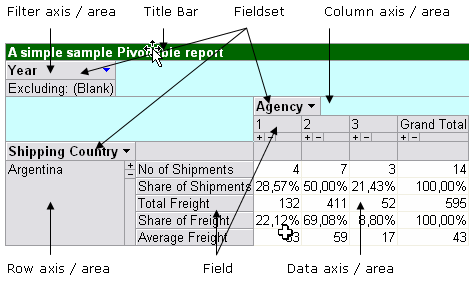
The below image shows how the control looks like after executing the code:
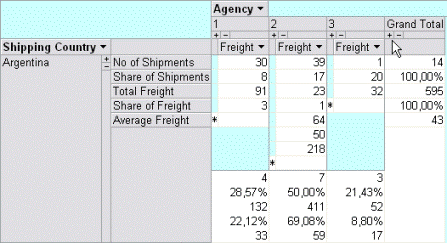
In the following example itís assumed that the Spreadsheet control is populated with a Recordset containing quarterly data for two countries. In addition itís a request to show the maximum / minimum amount of freight values as well as the number of shipments.
The following image show how the form is set up in the first place:

The formulas have been created at design time and the formulas are the following:
Max: =MAX(C2:C9)
Min: =MIN(C2:C9)
When clicking on the ìView chartî ñ button the form expand and show the Chart control as the following image shows:
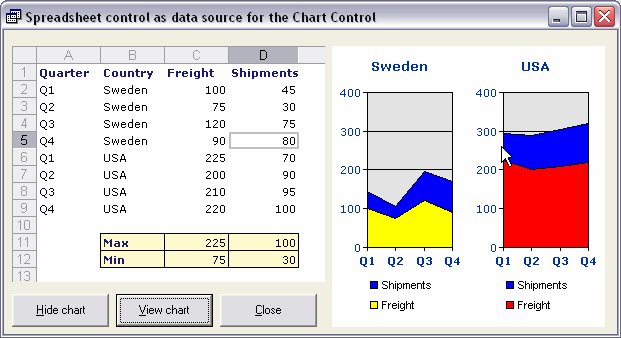
Whenever the underlying data is updated in the Spreadsheet control itís automatically reflected in the Chart control.
The following code does all the hard work to set up the Chart space and the two charts:
‘Ranges with data for the charts.
Const stData1 As String = “Datasource!A2:D5”
Const stData2 As String = “Datasource!A6:D9”
Dim owcSpread As OWC11.Spreadsheet
Dim owcChart As OWC11.ChartSpace
Dim stTitle1 As String, stTitle2 As String
Dim stLegend1 As String, stLegend2 As String
With Me
.Width = 9315
Set owcSpread = .Spreadsheet1
Set owcChart = .ChartSpace1
End With
With owcSpread.ActiveSheet
stTitle1 = .Range(“B2”).Value
stTitle2 = .Range(“B6”).Value
stLegend1 = .Range(“C1”).Value
stLegend2 = .Range(“D1”).Value
End With
With owcChart
.Clear
‘Set up the Spreadsheet control to be the data source.
.DataSource = owcSpread
‘Remark: We are forced to add both the 1st and 2nd chart.
‘Add the first chart.
.Charts.Add
‘Add the second chart.
.Charts.Add
‘If we want to use the same scale for the Y-axis for all the charts then
‘we need to set this property to true.
.HasUnifiedScales = True
.Border.Color = vbWhite
‘By changing the layout we can control how the charts are presented
‘inside the Chart space.
.ChartLayout = chChartLayoutHorizontal
End With
‘Set up the charts and manipulate some of their properties.
With owcChart.Charts(0)
.Type = chChartTypeAreaStacked
‘The data reference must be of the datatype string.
‘The last parameter specify if each row represent a serie or not.
.SetSpreadsheetData stData1, False
.HasTitle = True
With .Title
.Caption = stTitle1
.Font.Name = “Verdana”
.Font.Size = 10
.Font.Bold = True
.Font.Color = RGB(0, 51, 153)
End With
With .SeriesCollection(1)
.Interior.Color = vbYellow
.Caption = stLegend1
End With
With .SeriesCollection(2)
.Interior.Color = vbBlue
.Caption = stLegend2
End With
With .Axes(0).Font
.Name = “Verdana”
.Size = 8
.Bold = True
.Color = RGB(0, 51, 153)
End With
With .Axes(1).Font
.Name = “Verdana”
.Size = 8
.Color = RGB(0, 51, 153)
End With
.HasLegend = True
With .Legend
.Position = chLegendPositionBottom
.Border.Color = vbWhite
.LegendEntries(2).Visible = False
End With
End With
With owcChart.Charts(1)
.Type = chChartTypeAreaStacked
.SetSpreadsheetData stData2, False
With .SeriesCollection(1)
.Interior.Color = vbRed
.Caption = stLegend1
End With
With .SeriesCollection(2)
.Interior.Color = vbBlue
.Caption = stLegend2
End With
.HasTitle = True
With .Title
.Caption = stTitle2
.Font.Name = “Verdana”
.Font.Size = 10
.Font.Bold = True
.Font.Color = RGB(0, 51, 153)
End With
With .Axes(0).Font
.Name = “Verdana”
.Size = 8
.Bold = True
.Color = RGB(0, 51, 153)
End With
With .Axes(1).Font
.Name = “Verdana”
.Size = 8
.Color = RGB(0, 51, 153)
End With
.HasLegend = True
With .Legend
.Position = chLegendPositionBottom
.Border.Color = vbWhite
.LegendEntries(2).Visible = False
End With
End With
Set owcSpread = Nothing
Set owcChart = Nothing
End Sub
To sum up
For the last three years I have shipped over 20 customs solution that, in one or another way, include one or more of the controls in the OWC. Iíve mainly used them in COM add-ins for Excel or as part of VB 6.0-solutions but due to NDAs Iím not able to show any of these solutions in public. Anyway, up to this date no issues have been reported to me due to the use of these controls and therefore I find them to be trusted.
This post ends the introduction of the OWC package and although I have only skimmed on the surface I hope that you at least now have an idea about them.
Kind regards,
Dennis