The Pivottable control
I thought I could cover most things about the control in one post but I realized it requires two posts instead and here comes the first one.
The control explicit target to view data in a way that support decision making and let the users view the data enabling them to “holistic look thru” the data.
The name of the control associate it strongly to the built-in Pivottable in Excel and on its face it’s very similar to the Pivottable in Excel however there exist some difference between them, which this and next part hopefully can point out.
The control is explicit designed to work with OLAP (Online Analytical Processing) data sources, which can be best described as multidimensional databases and extracts from databases (cubes). The structure is a N-matrix and each dimension consist of members (items) and the intersection of N members holds the value. OLAP is the best and fastest way to work with large amount of multidimensional records and implicit it also point out one of the strongest abilities of the control, the drilling down capacity.
The control can also work with tabular data sources, such as less complex databases, Excel worksheets, textfiles and row formatted XML-files.
It’s beyond the scoop of this post to describe OLAP in detail as it can be both very abstract and very complex. To fully understand OLAP it will require a book on the subject and lot of practice and therefore the following refer to tabular data source.
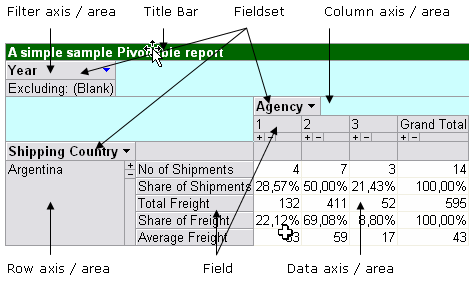
The terminology associated with the control is different compared with the built-in in Excel. In order to work with it programmatically and with tabular data sources we need at least a basic understanding of the terms in use and what they actually refer to. The following picture shows the keywords in use and what part of the control they refer to.

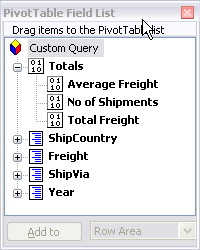
Like the built-in Pivottable the control also have a viewable field list enable the users to drag and drop fields. The symbol with 0’s and 1’s represent calculated fields.

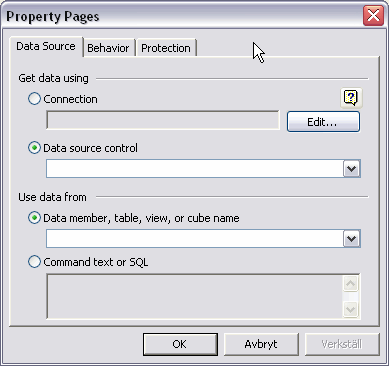
Connecting data sources to the control can be done in two ways, as with most data controls, either via a property page or via code at runtime. Personally I prefer to do it via code as it gives me more control and make it easier to change.
The following picture shows where we can setup the connection etc via the property page of the control:

The code-example in the next part will show how we do it programmatically.
Unlike the built-in sibling in Excel the control does not rely on a pivot-cache. The control also uses ADO to load the retrieved data into the component Windows Cursor Engine (WCE) which is part of the Microsoft Data Access Components (MDAC) and it use its own memory cache to hold the data (and if necessary, due to the amount of returned data, pages it to disk).
After the data has been loaded into the cache the control then can communicate with it to view data, filter data and drilling down.
Kind regards,
Dennis
Posting code? Use <pre> tags for VBA and <code> tags for inline.