Programming the Pivottable control with MS VB 6.0 SP-6
If we intend to use an ADO-classic approach to populate the control with a Recordset then one way is to use a disconnected Recordset like the following snippet code example shows:
.CursorLocation = adUseClient
.Open stCon
Set rst = .Execute(stSQL)
Set rst.ActiveConnection = Nothing
.Close
End With
ptTable.DataSource = rst
For demonstration purpose the example use the “OLAP-approach” which means that the control is directly connected to the source during the session.
Function Setup_PivotTable()
Const stCon As String = _
“Provider=SQLOLEDB.1;Integrated Security=SSPI;” & _
“Persist Security Info=False;Initial Catalog=Northwind;” & _
“Data Source=IBM”
Const stSQL As String = _
“SELECT ShipCountry, Freight, ShipVia, “ & _
“ShippedDate AS Year “ & _
“FROM Orders;”
Dim ptTable As OWC11.PivotTable
Dim ptView As OWC11.PivotView
Dim ptFsets As OWC11.PivotFieldSets
Dim ptField As OWC11.PivotField
Dim ptTotal As OWC11.PivotTotal
Dim ptCommand As OWC11.OCCommand
Set ptTable = frmOWCPT.PivotTable1
With ptTable
‘Establish the connection to the data source etc.
.ConnectionString = stCon
.CommandText = stSQL
‘In case no data is returned we can catch it.
If .ActiveData Is Nothing Then
‘Message…
‘End the procedure…
End If
Set ptView = .ActiveView
End With
Set ptFsets = ptView.FieldSets
With ptView
‘Add the Year by Week-field to the Filter area.
.FilterAxis.InsertFieldSet ptFsets(“Year by Week”)
‘Exclude records with empty years. ‘In case of multilanguage enviroment then
‘the Array ‘should be applied then any local word for ‘Empty’.
.FieldSets(“Year by Week”).Fields(0).ExcludedMembers = Array(“”)
‘Add the Year by Month-field to the Filter area.
.FilterAxis.InsertFieldSet ptFsets(“Year by Month”)
.FieldSets(“Year by Month”).Fields(0).ExcludedMembers = Array(“”)
‘Add the ShipCountry-field to the Row area.
.RowAxis.InsertFieldSet ptFsets(“ShipCountry”)
.FieldSets(“ShipCountry”).Fields(0).Caption = “Shipping Country”
‘Add the Shipvia-field to the Column area.
.ColumnAxis.InsertFieldSet ptFsets(“ShipVia”)
.FieldSets(“ShipVia”).Fields(0).Caption = “Agency”
‘Add the Freight-field to the Data area.
.DataAxis.InsertFieldSet ptFsets(“Freight”)
‘Add Total calculated field.
.DataAxis.InsertTotal ptView.AddTotal(“No of Shipments”, _
ptFsets(“Freight”).Fields(0), _
plFunctionCount)
.DataAxis.InsertTotal ptView.AddTotal(“Share of Shipments”, _
ptFsets(“Freight”).Fields(0), _
plFunctionCount)
‘Show the calculated field as percentage of the row
‘and hide the field from being displayed in the fieldlist.
With .Totals(“Share of Shipments”)
.ShowAs = plShowAsPercentOfRowTotal
.DisplayInFieldList = False
End With
.DataAxis.InsertTotal ptView.AddTotal(“Total Freight”, _
ptFsets(“Freight”).Fields(0), _
plFunctionSum)
.DataAxis.InsertTotal ptView.AddTotal(“Share of Freight”, _
ptFsets(“Freight”).Fields(0), _
plFunctionSum)
With .Totals(“Share of Freight”)
.ShowAs = plShowAsPercentOfRowTotal
.DisplayInFieldList = False
End With
.DataAxis.InsertTotal ptView.AddTotal(“Average Freight”, _
ptFsets(“Freight”).Fields(0), _
plFunctionAverage)
‘Format fields.
.FieldSets(“Freight”).Fields(0).NumberFormat = “0”
.Totals(“Total Freight”).NumberFormat = “0”
.Totals(“Average Freight”).NumberFormat = “0”
‘View Total captions as Rowheadings instead as Columnheadings (default).
.TotalOrientation = plTotalOrientationRow
With .TitleBar
.Caption = “A simple sample Pivottable report”
.BackColor = RGB(0, 102, 0)
.ForeColor = vbWhite
End With
‘Disallow users from editing the data.
.AllowEdits = False
End With
With ptTable
‘Uncheck the option to show the Drop Areas.
‘No property of the Pivottable is accessible to show/hide it via code.
‘At least I’m not aware of any.
Set ptCommand = .Commands(plCommandDropzones)
ptCommand.Execute
‘Collapse the Pivottable so that only summary data is shown.
.ActiveData.HideDetails
.Refresh
‘If necessary, show the Fieldlist.
.DisplayFieldList = True
‘Fix the Pivottable’s size in the form.
‘The Autofit property is automatically set to False when we set the
‘height and width properties of the control.
With .Object
.Height = 460
.Width = 710
End With
.BackColor = RGB(204, 255, 255)
End With
‘Release objects from memory.
Set ptCommand = Nothing
Set ptFsets = Nothing
Set ptView = Nothing
Set ptTable = Nothing
End Function
When populating the control with data via code no Totals are automatically added and therefore we need to do it with code as well.
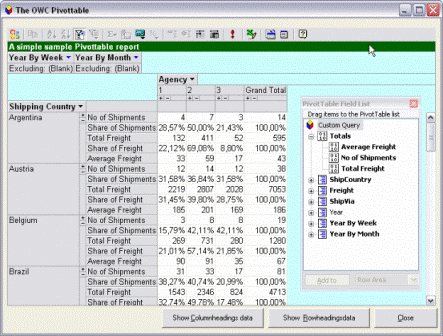
The following picture shows the initial status after that the above code has been executed:
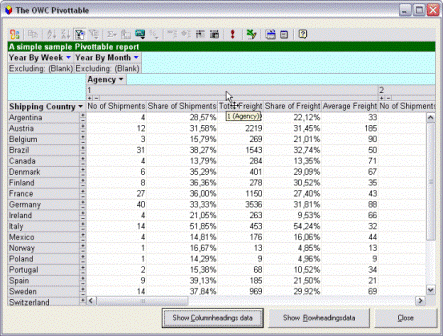
By resetting the orientation of the Totals captions to default following view is obtained:
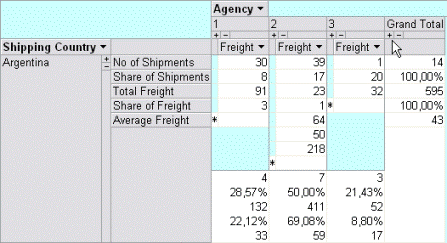
By drilling down the underlying data is viewed which may give a better understanding of pattern etc:
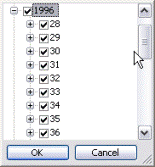
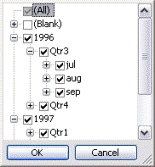
If we use any date related field the control will per automatic generate two sets of hierarchies for each date field. One hierarchy (Year by Month) contains the grouping of Year, Quarter, Month and Day and the other (Year by Week) contains the interval Year, Week and Day. The basic explanation for the existence of two hierarchies is that weeks do not always follow the months. In the example one date field (as Filter field) is used and therefore the control generates the following hierarchies.
Year by Week and Year by Month (Days are not viewed in the picture):
In the example the Toolbar of the control is available and one of the coolest features of the control is the ability to export to Excel. By clicking on the Excel-button the active view is exported to Excel and a built-in Pivottable is created with the data.
The Pivottable control places a high demand on developers but in return we get a flexible and a very powerful control which may leverage any solutions for business analysis and reporting.
In the next two coming parts the Spreadsheet control will be introduce.
Kind regards,
Dennis
Daily Dose of Excel
If you work with Microsoft Excel and you want to improve your skills, one blog I highly recommend you read is Daily Dose of Excel. Dick Kusleika along with his terrific authors provide a wealth of information and knowledge. The…
This only works for Excel 11.0 (2003)?
Hi,
I’m not sure what You refer to but let see if I can give You some input.
The OWC library is independed from Office and the controls can be used with different kind of softwares as well as with different versions of softwares, including MS Office. You can download the library from MSFT and use it for free.
The given sample is developed with MS Visual Basic 6.0 but it can also be used with let say Excel 10.
The major drawback with working the controls in Excel (as explained in the first post about OWC) is that a security message will be viewed whenever the form the control(s) are placed in are initialized.
The best solution is therefore to create COM add-ins.
The possibility to use COM add-ins are only available from version 2000 and later of Excel.
Kind regards,
Dennis
Just curious as the reference to OWC11.OCCommand gives and undefined type error in Excel 2000. As does any reference using OWC11. Pointing to Office Web Component (OWC) fails OWC.OCCommand. I have downloaded the web components and have VB 6.0 Professional Edition as well (though several years old now)
Please let me know the following enabling me to set up a similar enviroment for testing purpose:
* Windows version and SP installed
* SP installed for Excel.
Can I assume You use english version of the softwares?
TIA,
Dennis
I made some quick test with using the PT control in a userform in Excel and it seems that the version 11.0 does not work properly with Excel 2000 while the version 10.0 seems do work. All the versions of OWC seems to work with 2002 and 2003.
What happen if You set up the control with VB and then export it to Excel 2000?
If You like You can create a COM add-in with the version 11.0 and then test it with Excel 2000.
Kind regards,
Dennis
i notice for the 1st time that access 2002 uses these controls – does 2000 use them doco?
cheers
ROss
Hi Dennis,
I need to retrieve aggregates values in order to populate a chart as chDataLiteral. I won’t connect the chart to the pivot directly as synching filters seems to be quite complex to implement..
Anyhow, one would normally get aggregates through a :
with pt.ActiveData
val = .Cells(.RowMember(r), .ColumnMembers(c))
.Aggregates(0).value
end with
Point is there is no Column field but DataAxis has a calculated (sum of) PivotTotal.
Would you know how to scan the PivotTotal to collect selected values?
Thanks,
– Philippe
Dennis,
I found out why filters would not synch between the chart and pivot. I was using an owc10 chart guid with and an owc11 pivot. “I’ bin a Trotle” as they say in Styria ;)
Anyhow, any hint on retrieving aggregates on a pivot where no column member is defined would still be appreciated.
thanks,
– Philippe
Dennis, can you describe how to tell the OWC Pivot Table control what hierarchies to display in its field list and use in the Pivot Table drill down? For each of my fields, I have a many-to-many hierarchy described in a view in a SQL Server DB, and I’d like to use these hierarchies to generate a Pivot Table with drill-down capabilities.
If one of the column fields is date would someone show me the code for grouping the date field by month and quarter?
Thanks,
/jerry
Hi,
Is possible to prevent the filter action (whit AllowFiltering=False) only for column and row axis and permit it for filter axis?
Thanks
It’s posible to create a PivotTable but whitout using de ConnectionString but using a DataSet or a Datatable?
Salute
Gabriel.
Hi,
How do i apply this to classic asp? i know that we need to define the pivot component thru tag, but then how the pivot gets populated? do you have any sample codes for this. Thanks for your help
How to change the visibility of items?
myPivotItem.visible = false/true generates error!!
I have tried ManualUpdate, AutoSort and all those things that generally work on pivots with data source other than an OLAP Cube, but could not get this visiblity thing fixed.
Help will be much appreciated.
In case anyone wants to know, the combination of OWC PivotTable + OCW (Offline Cube Wizard)-generated OLAP .cub file does not allow the addition of calculated fields or totals (just as is the case with Excel PivotTables).
appreciate this article, i was searching thru on how to multiple dataAxis in row view, this really helped especially
the below command :
.TotalOrientation = plTotalOrientationRow
and
.ActiveData.HideDetails