The Chart control
The control is actually a chart space in which one or more charts can reside in. The chart space is also the top object in the control’s object model and like the other controls in the OWC package some properties can only be manipulated through the chart space.
In addition to databases, text-/XML-files both the Spreadsheet control and the Pivottable control in the OWC package can be used as data sources for the Chart control.
One of the Chart control’s more powerful abilities is that charts can either be of the standard type of chart or genuine pivot charts.
If we want to display several charts in the same chart space we need to consider some limitations of the chart space such as:
* The same data source must be used.
* The same categories names on the x-axis and the same values on the y-axis must be used.
* Not all types of chart can are supported.
As for the chart object in the control it’s very like the sibling in Excel but it has a more complex object model which can be difficult to grasp (at least for those of us who are not chart-specialist per se). On the other hand we don’t need to manipulate so many properties and methods of the chart object in order to get a functional solution. The number of supported types of charts exceeds 60 which should be sufficient for most cases.
The example below use a rowset based XML-file as a data source and creating an XML-file can be done in several ways. One of the more simple ways to generate an XML-file with Excel is as the following example shows:
Sub Create_XML_File()
‘Early binding – add a reference to the Microsoft ActiveX Data Objects 2.5 Library or later.
Dim rst As ADODB.Recordset
Dim str As ADODB.Stream
Const stCon As String = _
“Provider=SQLOLEDB.1;Integrated Security=SSPI;” & _
“Persist Security Info=False;Initial Catalog=Northwind;” & _
“Data Source=IBM”
Const stSQL As String = _
“SELECT ShipCountry AS Country, SUM(Freight) AS Freight, “ & _
“COUNT(Freight) as Shipments, “ & _
“YEAR(ShippedDate)AS Year “ & _
“FROM Orders “ & _
“WHERE YEAR(ShippedDate) IS NOT NULL “ & _
“GROUP BY ShipCountry,YEAR(ShippedDate);”
Set rst = New ADODB.Recordset
Set str = New ADODB.Stream
With rst
.CursorLocation = adUseClient
.Open stSQL, stCon, adOpenStatic, adLockReadOnly, adCmdText
.Save str, adPersistXML
.Close
End With
With str
.SaveToFile “C:Report.xml”, adSaveCreateOverWrite
.Close
End With
Set str = Nothing
Set rst = Nothing
End Sub
The following image shows the output after that the below code has been executed:
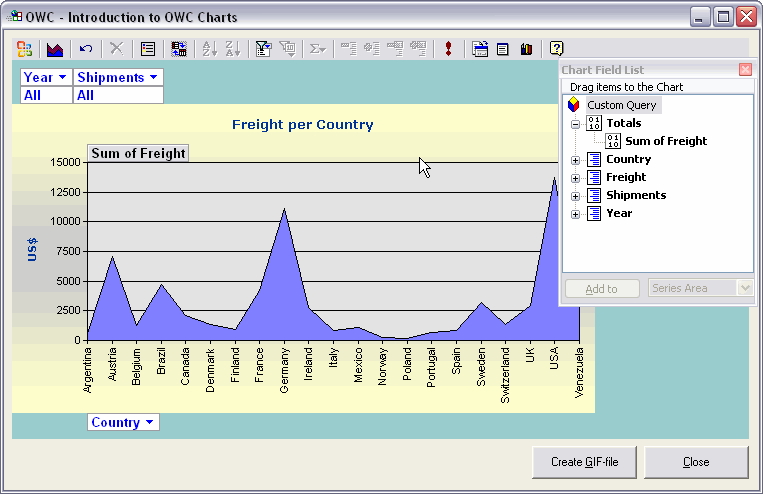
The default number of charts is one and if we want to have additional chart then we need to add them via code.
The following procedure sets up the chart space and the chart:
Public Function Set_Up_Chart_Control()
Const stCon As String = “Provider=MSPersist;”
‘The data source must follow the Recordset Persistance schema
‘when using XML-files.
Const stFile As String = “C:Report.xml”
Dim owcChSpace As OWC11.ChartSpace
Set owcChSpace = frmChart.ChartSpace1
‘Setup the Chart Space.
With owcChSpace
‘Clear the space.
.Clear
.ConnectionString = stCon
.CommandText = stFile
.Border.Color = RGB(153, 204, 204)
.Interior.Color = RGB(153, 204, 204)
.DisplayToolbar = True
.DisplayPropertyToolbox = False
.DisplayFieldList = True
‘By setting this property to false a standard chart
‘and not a PivotChart is created.
.DisplayFieldButtons = True
‘Prevent the user(s) from doing anything else except filter the data
‘and add / remove fields.
.AllowUISelection = False
‘Populate two dimensions with fields from the data source.
.SetData chDimCategories, 0, “Country”
.SetData chDimValues, 0, “Freight”
‘If we want to use several fields for data filter etc we can use arrays.
.SetData chDimFilter, 0, Array(“Year”, “Shipments”)
With .DropZones(chDropZoneFilter)
.ButtonInterior.Color = vbWhite
.ButtonFont.Color = vbBlue
End With
With .DropZones(chDropZoneCategories)
.ButtonInterior.Color = vbWhite
.ButtonFont.Color = vbBlue
End With
End With
‘Setup the chart.
With owcChSpace.Charts(0)
‘Choose the chart type.
.Type = chChartTypeAreaStacked
.HasTitle = True
With .Title
.Caption = “Freight per Country”
.Font.Name = “Verdana”
.Font.Size = 10
.Font.Bold = True
.Font.Color = RGB(0, 51, 153)
End With
.Interior.SetTwoColorGradient chGradientHorizontal, _
chGradientVariantCenter, _
RGB(255, 255, 204), _
RGB(204, 204, 204)
‘Set up the Value-axis.
With .Axes(1)
.HasTitle = True
With .Title
.Caption = “US$”
.Font.Name = “Verdana”
.Font.Bold = True
.Font.Size = 8
.Font.Color = RGB(0, 51, 153)
End With
End With
.HasLegend = False
End With
Set owcChSpace = Nothing
End Function
The Chart control can’t export the underlying data to Excel (or to any other program) but it can create an image of the viewed chart, in GIF, JPEG or in the PING format. The following snippet code shows how this can be achieved:
Dim owcChSpace As OWC11.ChartSpace
Set owcChSpace = Me.ChartSpace1
‘Create the filename.
stFileName = _
Replace(CStr(Date), “-“, “”) & _
Replace(CStr(Time), “:”, “”) & “.gif”
With owcChSpace
‘Temporarily hide the toolbar.
.DisplayToolbar = False
‘Export to a standalone GIF-file.
.ExportPicture _
FileName:=“c:DDE” & stFileName, _
FilterName:=“gif”, _
Width:=700, _
Height:=440
‘Display the toolbar again.
.DisplayToolbar = True
End With
MsgBox “Done!”, vbOKOnly, “OWC Chart”
Set owcChSpace = Nothing
In the last post about the OWC I will show how we can use the Spreadsheet control as a data sources for the Chart control.
Kind regards,
Dennis
Good job Dennis
The past items have been great.
Thanks for taking your valuable time and posting these
items
Jim
Jim,
Many thanks for Your kind words :)
Next post will end the serie about the OWC and then we will target a new other interesting area!
Kind regards,
Dennis
Dick,
How can we change the setting within
OWC so that an export to an Excel Pivot Table
WILL NOT include the phrase Persist Security Info = True?
The security risks here are very apparent
when Excel allows credentials to be passed along
inside the Edit Query box of the Pivot Table.
Any ideas?
John B
The basic idea of control charts can be found in quality control methods where a process is visualized inside two tolerance limits. These limits should be well within the specifications given by the customers. Violating which means the process is incapable of meeting customers’ requirements.
Hi,
I’m working on a chartspace which is link to a spreadhseet (OWC).
I have managed to arrange the fields & categories but I’m struggling to manage simple format elements as: ReverseOrder for instance.
As well my X Axes (Abscise) is holding Dates and I have noticed 2 problems. First is that it create marks for each days including weekends where there aren’t any data for for those days (ie dates aren’t not in the spreadsheet but they happear on my chart), as well, if I load a lot of data in teh spreadsheet and then create the chart, some data are accumulated into 1 record, I would like that each column show 1 record only and not the sum of few records.
Please let me know if you can direct me to any website with documentation relative to those problems.
Thank you and regards
Arnaud
I need how can I add to series data de data field “country” for example create serie1 Argentina serie2 Autralia ……..
i need to add “country” to the series area automatic