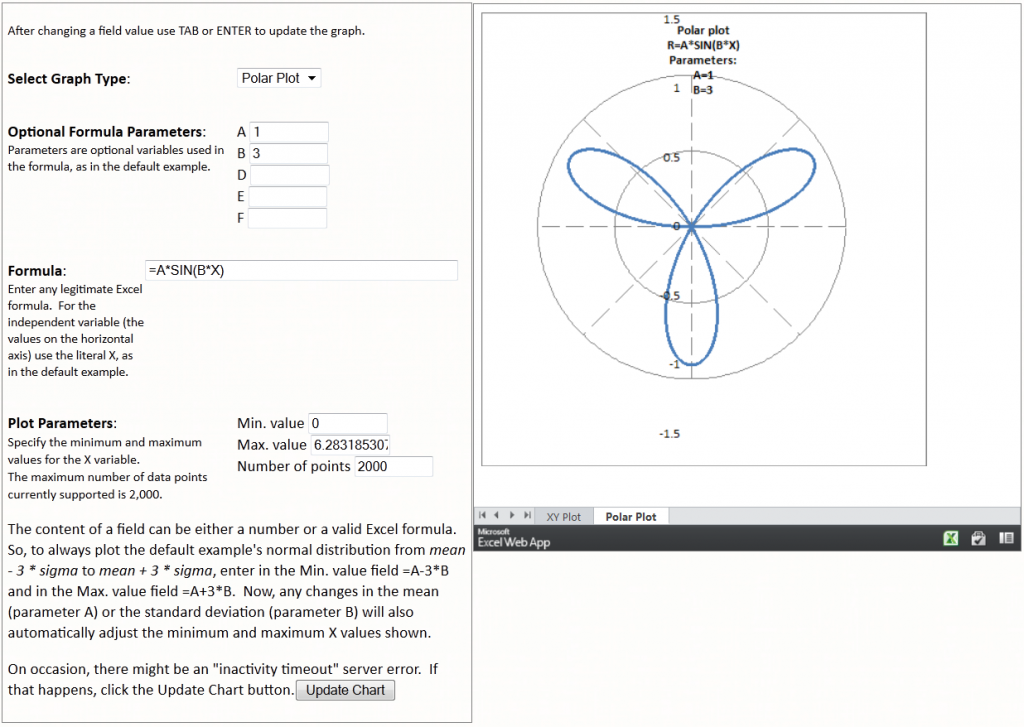
Following up on the previous post (http://www.dailydoseofexcel.com/archives/2012/01/25/excel-mashup-1/) I extended the capability to create a Polar plot using a 2nd worksheet in the same workbook. The consumer provides graph parameters, including the graph type, using HTML form controls. The graph is in an Excel workbook.
Graph any Excel formula in a XY (Cartesian) chart or a Polar plot

HI Tushar,
Nice work. And even nicer you greyed out the 3D plot choice :-)
Thanks.
Of course, the reason the 3D is currently disabled is that I plan to enable it in the future.
For the most part, 3D charts, especially the kind of charts available through Excel, serve only to enhance the aesthetic appeal and that too only when used judiciously. And, you know what? I don’t have a problem with that. People live in a 3D world. Instead of just showing a column chart, a column chart with 3D columns is aesthetically more appealing. Similarly, a pie chart with 1 slice “pulled out” looks better in 3D. It may not add anything to the content but it is visually more appealing.
That said, there are instances where 3D graphs play a valuable role in data analysis. I am a strong believer that data shown in their natural context convey the most information. Several years back I worked with a researcher who was doing some kind of genetic work at one of the National Institutes of Health (NIH). I used an Excel XY Scatter chart to simulate a 3D chart that showed a 3D image of a helix. The researcher and her team loved the result. For the first time, they could see the 3D helix as a 3D object. They could rotate the X, Y, or Z axis to see the helix from different angles. I think I still have the code somewhere but haven’t found use for it since then. Like I wrote, 3D graphs have their uses in, and only in, appropriate scenarios.
In another instance, I was a consultant to a project that couldn’t figure out why productivity of a large facility occasionally dropped. There were too may variables and it was hard to figure out what was causing the problem. Lacking any better alternatives, I created many (15? 20?) 3D surface charts showing productivity vs. 2 variables at a time. When we rotated those surface charts (X/Y/Z dimensions), we could distinctly see instances where the surface dropped and it dropped sharply. The client technical staff jumped on the data and figured out the real cause of the problem. A problem that people had been banging their collective heads against for a while was resolved in minutes through 3D charts.