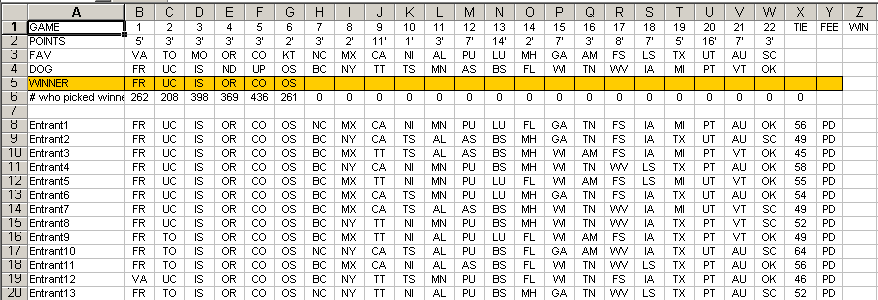
Well, the college football season is quickly coming to a close. With no hockey this year, I don’t know what I’ll do until next August. Watch baseball? Not likely. In the few remaining days, I’ll be watching a lot of bowl games which may be listed on betting platforms such as 겜블시티 가입 방법. Not necessarily because I like the match ups, but because I’m in a pool. The pool is arranged thusly:
Everyone gets -10 points for entering. Entrants pick 22 bowl games by the spread. Every loss is -10 points. The top 10 entrants get a percentage of the total points back at the end based on their position. Also, the person with the least points (the biggest loser) gets 1% of the total points at the end. Confusing? Here’s the spreadsheet

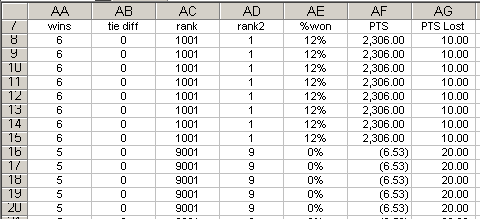
To keep track of what’s happening, I’ve added these columns

The formulas are as follows
$AB$8 =IF($X$5=””,0,ABS(X8-$X$5))
$AC$8 =(RANK(AA8,$AA$8:$AA$651)*1000)+RANK(AB8,$AB$8:$AB$651,1)
$AD$8 =RANK(AC8,$AC$8:$AC$651,1)
$AE$8 =IF(AD8=MAX($AD$8:$AD$651),VLOOKUP(11,percent,2,FALSE),IF(AD8>10,0,VLOOKUP(AD8,percent,2,FALSE)))
$AF$8 =(AE8*($AG$653))-AG8
AA8 – an array formula comparing that entrants picks to the winners.
AB8 – If there’s a tie, the entrant has to predict the combined score of the championship game. If the championship game hasn’t been played, X5 will be blank and this column will be “uninitialized”. Otherwise it will show the tie breaker.
AC8 – This creates a ranking based on the two parameters, most wins and the tie breaker. The first rank is multiplied by 1,000 to keep it separate from the second rank. If there were more than 1,000 entrants, this would have to be made 10,000.
AD8 – This ranks the AC8 ranking to give the actual position of the entrant.
AE8 – This figures the percentage of the points won. The first part, AD8=MAX, tests to see if this person is the biggest loser. If so, the “11? column is taken from the percent table. If it’s greater than 10, then they get zero, otherwise it gets the appropriate percentage from the table (shown below).
AF8 – Takes the percentage won times the total pot and subtracts AG8. AG8 is the number of losses for that entrant times 10 points.
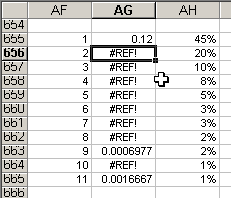
The percent table is shown below:

AG655 has this formula which is filled down to AG664
Oh boy, that formula took a long time to get right. This computes the percentage won by rank. Since there is currently and 8-way tie for 1st, it adds up the percent won for the first 8 spots and divides it by the number of winners. There are at least two people tied for ninth, so positions 2-8 and 10 have no percentage.
The 11th spot uses this formula
which divides the 1% that the big loser wins by however many big losers there are.
You can look at the whole spreadsheet at Download Bash05Blog.zip.
Hi,
A Hungarian friend made some beautiful excel-file about european football.
The language is hungarian, but great!
Here is:
http://www.nemzetisport.hu/cikk.php?cikk=16503
Zoltan
trying to put together a football pool, 100 squares, 10 rows x 10 rows. Cant find the format to fit this idea
Thanks,
Chris York
Chris: See if this fits the bill
http://www.dailydoseofexcel.com/archives/2007/09/24/office-football-pool/
Does anyone know of an excel spreadsheet that will calculate a confidence pool. Pool members make weekly picks on every NFL game, assigning their own point value to each game. Picks are made “straight up”, not using a point spread system. The winning player for each week is determined by totalling the point values assigned to correctly picked games. Assuming there are 15 games, pick 15 would be my most confident pick and pick 1 would be my least confident pick. For example if I pick Pittsburgh at 15, I will get 15 points if Pittsburg wins. If Pittsburgh loses, I do not receive any points. If Carolina is my 1 pick and they lose, I will only sacrifice 1 point because they are my least confident pick. It would also be nice if the spreadsheet would show current rankings of pool participants as games are completed and scored on the spreadsheet. Thanks.
Jay: Try this for starters
http://www.dailydoseofexcel.com/excel/Confidence.zip
Wow, that is great. The pool I manage has over 30 entrants. The format we follow has the confidence points on the first row. It goes from 15 down to 1, left to right. The entry names are on the first column. The teams picked are scattered throughout the grid. Is it possible to follow this pattern? Thanks.
hello I need an excel formula to show win lost percentage, I thought it was number of win divided number of games but if I put in a lost the percentage would not change, ie if a team was 2-4 it would show 2.000% for total number of game in this case is 10. So what I trying to get total number of game is 10 but the percentage should not increase, pretty much like the pros the percentage stay at a 1.000% even if they have 3 win in a row but it they have a lost it goes down a bit.
If you add a loss, you add to the total games and the percentage goes down
2-4 = 2/6 = .333
2-5 = 2/7 = .286
I’m looking for a formula to help out in my weekly family football pool. Each person in the pool picks the winner of every game each week. I’d like to set it up so that by simply typing in the winner of each game, excel can calculate it as a win or loss for each person, keep a running tab of total wins/losses for that individual (either for just that week or a running total throughout the season), and if possible, even rank participants by their record. We tend to keep track of each week as a separate sheet.
PS Thanks for any help you can offer
I was able to figure out most of my scoring. The only thing I have left to figure out is an easy way to create copies of the sheet (make a copy of week 1 and adjust it to be the week 2 sheet) and only change the sheet reference of the formula. To keep track of total wins and losses, week 1’s formula(displayed in cell D34) is “=E28?. Week 2’s formula is “=E28+’Week 1’D34?. Week 3’s formula is “=E28+’Week 2’D34?. So, as the weeks go on, the only thing that needs to change is the sheet that is being directed to: Is there a more convenient way to do this instead of going to each cell and retyping the sheet name?
Guys, check out PoolPatron.com. They will manage you NFL and NCAA football pool for FREE. There is also a March Madness pool.
I am looking for a spreadsheet that will allow me to put in the NFL pool picks for the week with confidence points assigned to each pick and can tell me based on all entrants picks and assigned confidence points which win/loss scenarios would result in a weekly win for each entrant. This would allow me to provide “who should you root for” analysis to my pool patrons. In theory based on the picks that are made, you should be able to determine which entries can actually win (not tie) for the week before a single game is played. Does this exist?
In addition to the above it would be cool to be able to analyze the historical picks and values to predict future behavior. I have the past picks from every week for the last 5 years. If I could do some trending analysis as well that would be fun to make available to the participants.
I trying to find a formula that will count the number of winning picks per row for the format below. I know this may be asking to much but if we can also determine the winner of the tiebreaker.
Name Gm 1Gm2Gm3Gm4Gm5Tie Breaker
Triple G SDCINTENBALCARNE49
Arty BUFCINTENBALCARNE40
Azzwhooperz SDPITTTENBALNODEN48
Any ideas would most certainly be appreciated.
Thanks so much in advance.
db
Make a range of winners and name it WinnerList. Then this formula will give you a count of the winners.
Enter that with Control+Shift+Enter, not just Enter, because it’s an array formula.
Hi Dick,
Thank you so much for your quick response to my problem. My Control+Shift+Enter doesn’t work for some reason. It maybe because I have Office 2003, not sure but the results to this formula is always 1. I defined a range and named it Winnerlist like you said but always get a 1 as a result. Is there anything else I can do besides going out and getting a later version of Office?
Thanks,
You’re Awesome!
db
DB: I’m using 2003 too. Make sure Winnerlist is a vertical range, not horizontal.
please can anybody help me on how to get game for each week?
please can anybody help me on how to get game for each week?this is my phone 08068446604
I’m skeptical that Nebraska is joining the Big 10. The new season promises to be interesting. Wow!