Big Think posted a map showing what the world would look like if the countries swapped places so their population and land mass rankings matched. Pretty interesting.
Strangely enough, the US itself would not have to swap its population with another country. With 310 million inhabitants, it is the third most populous nation in the world. And with an area of just over 3.7 million mi² (slightly more than 9.6 million km²), it is also the world’s third largest country (2). Brazil, at number five in both lists, is in the same situation. Other non-movers are Yemen and Ireland.
Four countries out of ~200 have the same rankings? That doesn’t seem so strange to me. Well, it’s a little strange.
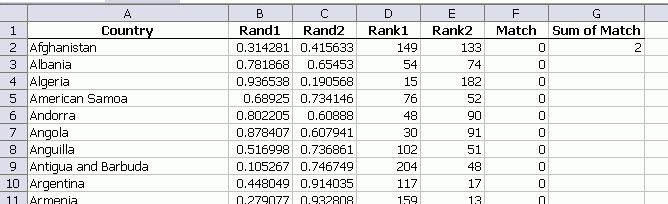
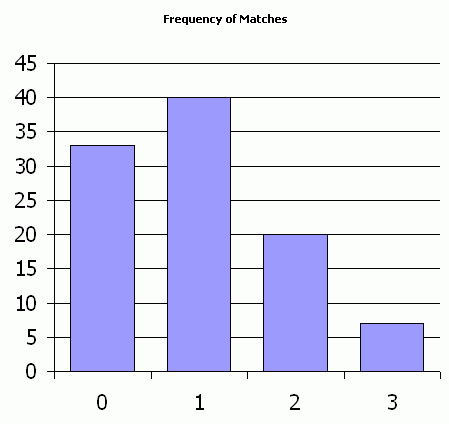
I listed 223 countries and assigned two random numbers to each. Then I ranked both random numbers and counted those countries with matching rankings. On recalculating, it fluctuates between zero and two. I saw a couple of threes and even one five.
I recalculated 100 times and recorded the results.
This, of course, assumes absolutely no correlation between population and land mass, which isn’t true. But I thought there would be more matches.
![]() You can download rankcountries.zip
You can download rankcountries.zip
Looks about right: assuming no correlation between population and land area, there’s a 222/223 chance that the two ranks will be different, so there’s a (222/223)^223 probability that no country will have the two ranks the same. That’s about 36.7%, close enough to your result.
This would be a good topic to play around with Spearman’s rank correlation coefficient. I guess it’s what you’re supposed to use when you don’t have normality and homoscedasticity in your data. In excel it’s implemented basically just using
after doing Paste Special -> Values for this example. Doing it this way, I get .0994. This is a bit out of my area or expertise but this says to me that we don’t have much of a relationship between land area and population or maybe we have a lot of randomness b/w the two.
I am thinking your experimental values should closely follow the binomial distribution where the number of trials is 223 and the probability of success on each trial is 1-222/223. In fact, they do, if you squint your eyes a little… Replace [Match#] with 0,1,2,3 in this formula:
Expected Frequency
Duh. I knew it was a “something” distribution but couldn’t remember what. So I had to figure it out, which is probably why I failed my Maths degree: too much time spent deriving stuff I couldn’t remember.
I ended up with this:
(That won’t actually work as presented in Excel case described: FACT(223) is a bit on the large side)
Where
N = number of countries
m = number of matches
If I’ve transcribed my scribble correctly, that should give the following probabilities for the first few “m”s:
1: 36.8%
2: 18.4%
3: 6.1%
4: 1.5%
Still very much in line with your results.
(Hopefully not double-posted – the first time I submitted this it appeared to have been “eaten”)
This is an interesting problem in probability. I think the expected distribution is equivalent to:
=POISSON(matches,1,0)
which is a little different than binomial, although becomes very close for large n.
The situation is analogous to picking n numbered balls out of a bag and matching them against an existing order. If the balls are replaced each time the frequency distribution would be binomial but if the balls are not replaced, they follow a distribution close to a poisson distribution.
Consider the case of just three items. There are 6 combinations in total, 2 with no matches, 3 with one match and 1 with three matches. The probabilities P(n,m) of m matches can also be calculated as shown below:
P(3,0) = 2/6 = (1 – 1 / 1! + 1 / 2! – 1 / 3!) / 0!
P(3,1) = 3/6 = (1 – 1 / 1! + 1 / 2!) / 1!
P(3,2) = 0/6 = (1 – 1 / 1!) / 2!
P(3,3) = 1/6 = (1) / 3!
This illustrates the general case, for further details see: http://en.wikipedia.org/wiki/Rencontres_numbers
In Excel, if n > 20 the results are indistinguishable from a poisson 1 distribution,
Lori — it’s not Poisson because the maximum possible number of matches is finite. The Poisson distribution isn’t finite. The correct distribution for matches of uncorrelated rank statistics is binomial, which is finite.
Fzz – perhaps i was a little unclear but i didn’t intend to imply that it was exactly Poisson, only that the results matched in Excel for moderately large sample sizes due to the limited precision as in the example given.
A general formula for m matches given n items is:
=NPV(-2,-1/FACT((ROW(INDIRECT(“1:”&n-m+1))-1)))/FACT(m)
although this will fail for n>170 because of the FACT function.
Just to clarify: the above formula should be array-entered and the smart quotes changed to normal quotes. I agree that the frequency of matches would be binomial if the ranks were uncorrelated but here we are dealing with random permutations. For a brief explanation refer to the probability distribution section of the linked wikipedia article and also the link to derangements.