Intrigued by the new Google Chart API, I decided to explore how to integrate Excel with it. My approach was to add a WebBrowser ActiveX control to a worksheet and then manipulate the HTML elements of the document in the browser. A couple of samples of how multiple charts float in the web browser window:
and
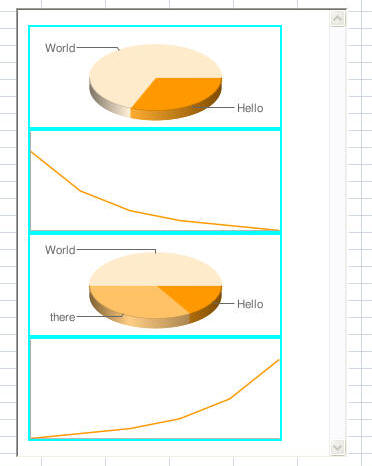
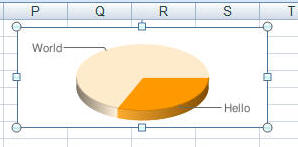
Another interesting consequence of this approach is that one can click-and-drag any of the charts from the browser window to the worksheet. This results in a static image of the chart.
The preliminary work is at
Using the Google Chart API with Microsoft Excel
http://www.tushar-mehta.com/publish_train/xl_vba_cases/excel_google_chart_api/index.htm
Posting code? Use <pre> tags for VBA and <code> tags for inline.