Dick signed me up almost two years ago as a contributor to this blog, and I finally decided it was high time I started making contributions, other than big-mouth comments to the posts of others.
On my web site, I’ve described VBA procedures that construct XY charts from regular but nonstandard data arrangements. Such procedures allow the user to chart from existing tables without rearranging the data and without suffering through tedious copying and pasting or repetitive range selection in the Source Data dialog. I’ve recently designed a utility to exploit these procedures.
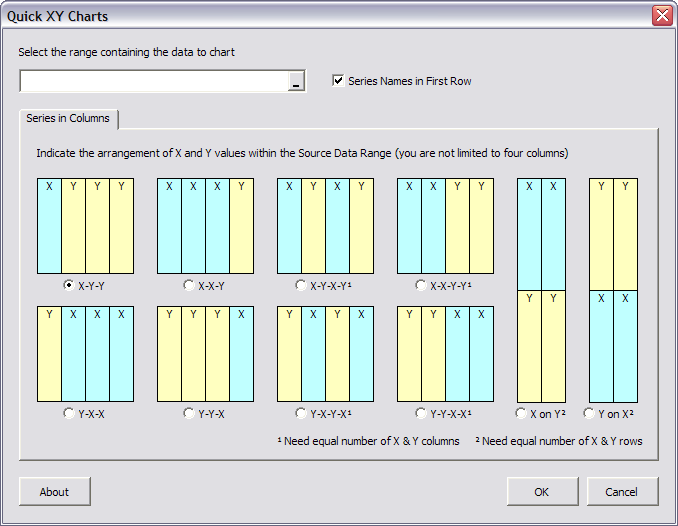
The Quick XY Charts utility is designed to work in Excel versions 2000, 2002, and 2003; it has not been tested in any Macintosh version or in Excel 97 or 2007, it may or may not work on these versions. The Quick XY Charts utility is a beta version, available at no cost in exchange for useful feedback. Ultimately it will be incorporated into a commercial Advanced Charting utility. The Quick XY Charts dialog is shown below:
The Quick XY Charts utility is available at Quick XY Charts Utility, which also has instructions for its installation and use.
I welcome any comments and suggestions, and will probably implement most reasonable feature requests. Bear in mind that this is a nights-and-weekends kind of project.
I’m also working on tools for building box and whisker charts, dot plots, waterfall charts, and more. I’ll post here to announce new modules when they become available, and at some point I’ll post an outline of the Advanced Charting utility which will contain these smaller tools.