In New Charting Utility – Box and Whisker Charts I introduced a utility for making simple box and whisker charts. In the intervening 14 months I have made a number of enhancements to this utility, including the ability to display outliers like the big expensive stats packages and a number of additional formatting options, and I’ve eliminated some bugs and enabled the utility to run without crashing in non-English versions of Excel (the utility uses English labels in all versions, but at least it doesn’t crash).
The Box and Whisker Charts utility is designed to work in Excel versions 2000, 2002, and 2003. It has not been tested in any Macintosh version or in Excel 97, and because of the older version of VBA in these products, the utility is not expected to run. The utility has only been lightly tested in Excel 2007, but it seems to work. This Box and Whisker Charts utility should be considered a beta version, and it is available at no cost in exchange for useful feedback.
The next version will most likely be incorporated into a commercial Advanced Charting utility. In addition to the features shown here, it will allow charting from computed statistics (the utility now uses the raw data as its input), and it will allow VBA programmers to call its methods from other VBA procedures.
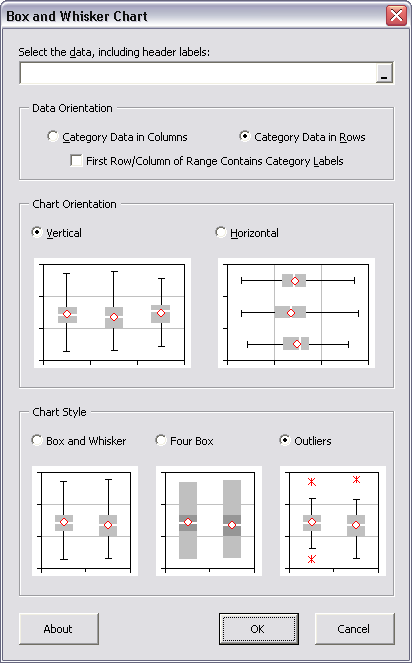
The Box and Whisker Charts dialog is shown below:
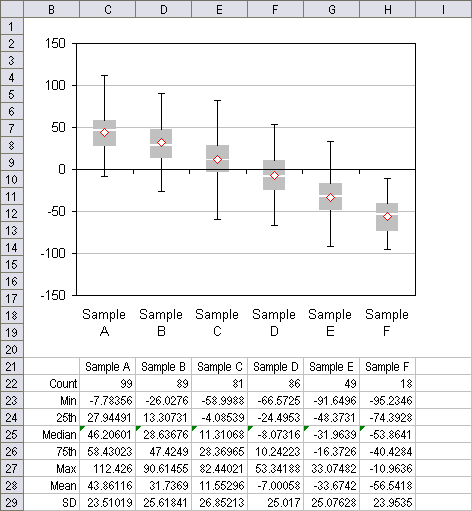
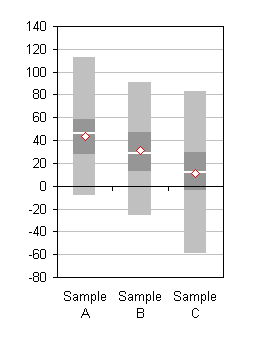
Typical output, in the form of a vertically oriented chart and a table, is shown here:
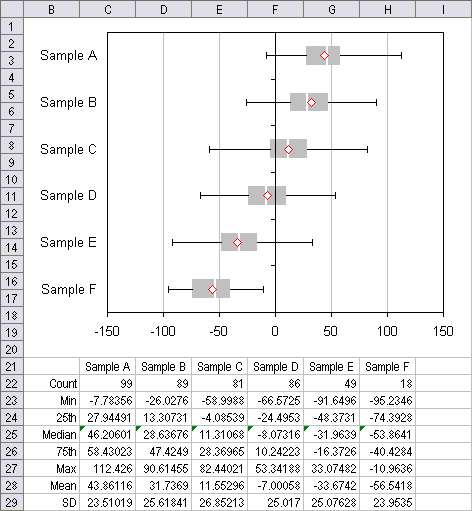
The chart is also available horizontally oriented:
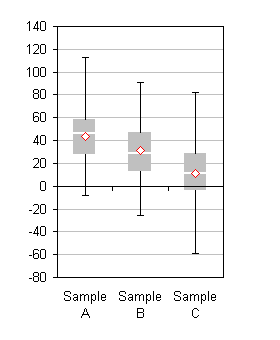
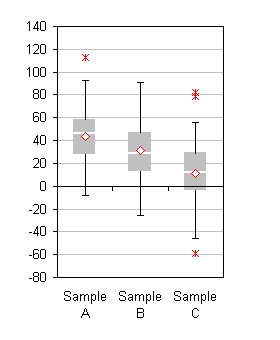
There are three styles available: Box and Whisker Quartiles, Four-Box Quartiles, and Box and Whisker with Outliers:
The utility can be downloaded from Box and Whisker Plots in the form of a zipped exe installation file. This page has instructions for installation and use. Any comments and suggestions are appreciated.
Wow thats a really nice work on box-plot charts. I´ve been struggling with these myself quite a lot, but you´ve managed to make them look really good. Will try the add-in as well.
Hi Jon,
I was using the first version a few weeks ago, UK Excel 2000 on XP, but it was crashing a lot! – I stopped using it in the end, I would be keen to test this version, will down load and test it out, post back with any FB,
Cheers
Ross
Jon, I’m looking forward to testing this addin. I run a lot of data vs. phase angle this looks like the plot I’ve been trying to find for the last 2 years.
Thanks,
Charles
450550.00¬
450100.00¬
450550.00¬
450100.00¬
450550.00¬
450100.00¬
450550.00¬
450100.00¬
450550.00¬
4501000.00¬
900100.00¬
450550.00¬
450100.00¬
450550.00¬
67500
In the above sets I can do totals in the first column but not on the second column, though both are supposed to be numbers. 6750 and 0 on the last line are obtained by summing the number in these columns.
I do not know how to attach the little spreadsheet but they are from a spreadsheet.
Could you please help me which function will change the second column into real number and sum will work?
Sorry it did not come as columns Could I use an email address of you so that I can attach the little spreadsheet?
Thanks
Is your second column comprised of numerical values, or is it a bunch of text disguised as numbers? There are a couple of ways to convert numbers stored as text to numbers:
1. Select the one-column range, go to Format menu > Cells, and make sure a numeric format (or General) is selected. Then use Data menu > Text to Columns, and in Step 3, make sure the General option is selected for Column Data Format.
2. Copy a blank cell, select the range of numbers stored as text, use Edit menu > Paste Special, and choose the Values and Operation – Add options, and press Okay.
Jon
I could not make it work and I took the liberty and send my little file to your email address
Please accept my apologies for any inconvenience
mathsmagician
Mathsmagician –
The cells in question are not numberic. You can make this clear if you don’t apply any horizontal alignment (i.e., use General on the Format Cells > Alignment tab). After removing the horizontal alignment, the numbers in the first column are right aligned (as numbers are by default), but those in the offending column are left aligned (as text is by default).
Each of the pseudo-numbers in the offending column ends with a non-breaking space, which throws off Excel’s data parsing algorithms. This character is obtained by holding Alt while pressing 0160 on the numeric keypad. In your post, these invisible characters were represented by “¬ºbr”, which should have been a tipoff that we were dealing with invalid characters.
Anyway, select the column, go to Edit menu > Replace, click in the Find What box and type Alt+0160, keep the Replace With box clear, and click Replace All. This will convert the cells to numeric.
Jon
Yes, Yes, Yes!
Hurray, it worked!
Thank you very much! I am very happy Ihave been smiling all afternoon
Cheers once aagain
Hello,
I love your box and whisker plot utility, and it appears to be exactly what I was looking for. BUT,I can’t figure out how to install it. I downloaded and extracted it. But I can’t figure out where it puts it, and there is nothing in the Excel Tools AddIns list.
Gladys –
If you extracted the exe file from the zip file, the only step left is to run the exe file, by double clicking on it in the Windows Explorer window. This file installs the add-in, and puts it in Excel’s list of add-ins. It also provides the menu/toolbar interface.
If you have further questions, feel free to follow up by email at jonxlmvp at peltiertech dot com.
hi i installed your package but it wil not launch it says invalid file ? could you help me with this thank you.
Pretty –
Could you send a description of your problem (include information about Office and Windows version and a screen shot of any error messages)?
Thanks,
– Jon
jp at peltiertech dot com