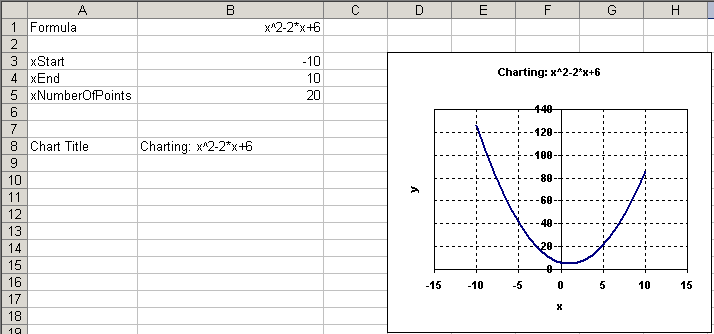
Charting a mathematical equation using Excel and defined names.
When doing mathematics, wouldn’t it be nice if we could type an equation into a cell in Excel and immediately see the resulting graph?
This article describes how this can be achieved by using just 4 input cells and a set of defined names.

Interesting: when using named range xValues = ROW(1:20) in range selected A1:A25 for instance, the numbering goes to 21 not the expected 20; with 22 – 25 showing #N/A. Same thing happens for any given ROW(N:N), the actual return is one more than expected…
Any explanations?
OK, I get to be chump again … ROW(…) is the key = it returns the row number – go figure :rolleyes: Boy is this embarrasing. What a boneheaded chump!
Hi Jan Karel
(a) I was just wondering how that differs from my ChtFrmla example? If you’re just explaining how it works, some accreditation would be nice :-)
(b) Because you’re defined name is substituting ‘x’ for your ‘xValues’ defined names in the formula, it means the technique won’t work for any function that contains the letter x, such as EXP(). If instead of using the name ‘xValues’, you use the name ‘x’, you don’t need the SUBSTITUTE(), and it works for all formulas.
Regards
Stephen Bullen
Hi Stephen,
Duh.
I must admit I never even looked at your version.
I will and refer to it as well. It might explain how I got the idea, but I had forgotten where I had seen it.
About the x’es. I started off using just x and at first couldn’t get it to work when I tried putting it in the SERIES formula. Then I changed two things simultaniously: the formula I used and replacing x with xValues. The two changes seemed to work, so I didn’t look back . Thanks for the comments.
What still doesn’t seem to work is using Excel functions in the first place: sin(x) gives all the same values so it seems. Any ideas?
Hi Stephen,
I have added a link to your ancient example.
I guess my pages are an explanation of how you did it, even if I didn’t use yours at first.
I’ve also done some heavy editing on the article, because the order in which things need to be done is very important to get this working.
Hi.
Neither yours or Stephen’s works for me > XL2003
Suspecting the odd looking EVALUATE function, I tried my own: =EVALUATE(“1+1?)
Excel complains: “That function is not valid.”
Oddly I got Stephen’s wkb to graph somehow by opening a combination of other workbooks in the background. I couldn’t reproduce the behaviour.
For me the workbook works in Excel 2003 after hitting F2, enter on the cell that holds the equation to be plotted. Earlier versions don’t seem to need this.
Looks like it does’nt work for user defined functions. Is that so?
Dion
I need some help with the equation of an arc. I want it to be part of a perfect circle in the +/+ quadrant. It should start at 0, 10 and go down to 10, 0. Can someone help me out with the equation for that?
Thanks!