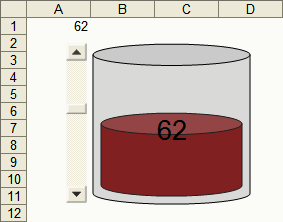
With some effort it is possible to draw Shapes and AutoShapes to act like charts.
If you’ve never played with AutoShapes before, I encourage you to look. I’ve wasted hours on it… well… that and playing Tetris.
Make sure the Drawing toolbar is visible: From the View menu select Toolbars, Drawing should be ticked.
It usually docks itself to the bottom of the screen.
AutoShapes have differences from regular Shapes. One difference is that you can set Transparency on them.
In this example I’ve configured two plain “Can” AutoShapes (From the Basic Shapes category).
The can in the foreground is transparent and gives that “coffee in a cup” look.

You’ll notice that I’ve attached a scrollbar. That’s just for fun.
If you want the scrollbar, run the Setup procedure to set it all up. Otherwise just run SetupContainer.
Put this code in a standard code module:
Const cDifference = 6, cRadialHeight = 8
Const cContainerName = “MyContainer”
Const cContentName = “MyContent”
Const cContainerColor = &H808080 ‘RGB(128, 128, 128)
Const cContentColor = &H80 ‘RGB(128, 0, 0)
Const cContentFormula = “=A1”
Sub Setup()
Dim ole As OLEObject
‘Adds a Scrollbar for fun
Set ole = ActiveSheet.OLEObjects.Add(ClassType:=“Forms.ScrollBar.1”, Left:=cLeft – 20, Top:=cTop, Width:=16, Height:=cHeight)
ole.Object.Min = 100
ole.Object.Max = 0
ole.LinkedCell = cContentFormula
SetupContainer
End Sub
Sub SetupContainer()
‘Creates the Content first
With ActiveSheet.Shapes.AddShape(msoShapeCan, cLeft + cDifference, cTop + cDifference, cWidth – cDifference * 2, 1)
.Name = cContentName
.Adjustments(1) = cRadialHeight * 2 / cHeight
.Fill.ForeColor.RGB = cContentColor
End With
‘Creates the Container last (for transparency)
With ActiveSheet.Shapes.AddShape(msoShapeCan, cLeft, cTop, cWidth, cHeight)
.Name = cContainerName
.Adjustments(1) = cRadialHeight * 2 / cHeight
.Fill.ForeColor.RGB = cContainerColor
.Fill.Transparency = 0.75
.Select
Selection.Formula = cContentFormula
.TextFrame.Characters.Text = “”
.TextFrame.Characters.Font.Size = 20
.TextFrame.HorizontalAlignment = xlCenter
.TextFrame.VerticalAlignment = xlCenter
End With
NewContentHeight Evaluate(cContentFormula)
End Sub
Sub NewContentHeight(sngHeight As Single)
Dim shp As Shape
Set shp = ActiveSheet.Shapes(cContainerName)
With ActiveSheet.Shapes(cContentName)
.Top = shp.Top + shp.Height – sngHeight – cDifference
.Height = sngHeight
If sngHeight = 0 Then
.Adjustments(1) = 0
Else
.Adjustments(1) = cRadialHeight * 2 / sngHeight
End If
End With
End Sub
Put this code in the worksheet code module:
NewContentHeight Range(“A1”).Value
End Sub
Private Sub ScrollBar1_Scroll()
NewContentHeight Range(“A1”).Value
End Sub
Private Sub Worksheet_Change(ByVal Target As Range)
If Not Intersect(Target, Range(“A1”)) Is Nothing Then NewContentHeight Range(“A1”).Value
End Sub
Very nice, my colleaques will be very impressed.
I added a shadow to the content and it looks even more 3D, especially when i scroll the values up/down.
Cool!
Very nice, Rob.
I’ve made drill-down map charts using similar methods.
Also used DrawingObjects to drive PivotTables. Users like interacting with pictures.
Hi, Joseph
I wonder if it were possible to send some examples you announced ( pivot tables linked with drawing objects)? It sounds quite interesting to me.
Thank you in advance
Jiri Cihar
jcihar@tiscali.cz