Bernie Deitrick showed a cool way to insert rows into a spreadsheet in answer to a newsgroup post this week.
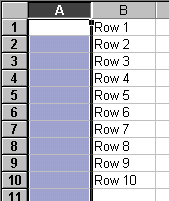
First, create a new column A.

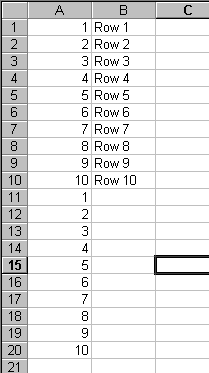
Next, fill numbers down for each row. Then copy those numbers to the blank rows below.

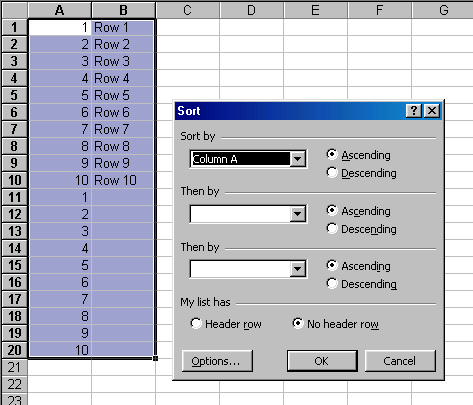
Sort on Column A


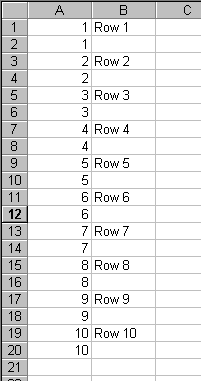
Then you can delete Column A and your done. Obviously it would be quicker to just insert rows when you only have 10 rows. But if there were more rows, this method would be quicker. I would have probably written a macro to do it, but I like these clever user-interface methods. Particularly if you just need to do it one time.
That’s a pretty cool idea. But I won’t use it, since it would save me time and I bill by the hour. Thanks anyway! ;-)
Just if you ever needed to do it by code:
Sub test()
Const cRows = 10
Dim i As Long
For i = 1 To cRows
Rows(i * 2).Insert
Next
End Sub
Thats a neat trick.
I have put this into a macro and it works pretty well.
The macro assumes there are no empty rows in the worksheet. It starts by finding the first empty row in column a. It also assumes the worksheet is called Sheet1.
Sub d()
With Worksheets(“Sheet1?).Range(“a1:a500?)
Set c = .Find(“”, LookIn:=xlValues)
If Not c Is Nothing Then
firstAddress = c.Address
Do
Set c = .FindNext(c)
Loop While Not c Is Nothing And c.Address firstAddress
End If
End With
Columns(“A:A”).Select
Selection.Insert Shift:=xlToRight
Range(c.Address).Select
endaddress = ActiveCell.Offset(-1, -1).Row
nextaddress = ActiveCell.Offset(0, -1).Address
Range(“A2?).Select
ActiveCell.FormulaR1C1 = “1?
Range(“A2:A” & endaddress).Select
Selection.DataSeries Rowcol:=xlColumns, Type:=xlLinear, Date:=xlDay, _
Step:=1, Trend:=False
Range(“A2:A” & endaddress).Select
Selection.Copy
Range(nextaddress).Select
ActiveSheet.Paste
Application.CutCopyMode = False
Cells.Select
Selection.Sort Key1:=Range(“A1?), Order1:=xlAscending, Header:=xlGuess, _
OrderCustom:=1, MatchCase:=False, Orientation:=xlTopToBottom, _
DataOption1:=xlSortNormal
Columns(“A:A”).Select
Selection.Delete Shift:=xlToLeft
Range(“A2?).Select
End Sub
Wow, I should have read the other reply first. That seems a lot easier.
I have dataset comprising of 4 variables (Company Code, Recommendation, Issuance Date, Review Date). “Issuance Date” is the date on which “Recommendation” was issued and “Review Date” is the date when the “Recommendation” was revised. This means that the “Recommendation” was constant between “Issuance Date” and “Review Date”.
I want to construct a time series for my data. It means that I should list all the dates between “Issuance Date” and “Review Date” in one column and “Recommendation” value in the column next to it.
Since, my date is too big, so I would like to write some macro that can do it automatically. We can define a new variable that shows us the difference of days between “Issuance Date” and “Review Date” and use that as an argument to create that many number of rows beneath the required row.
can anyone help me in this.
Omar –
What is the purpose of all of these rows? You can construct a time series, using a line chart with a date-scale axis (MS calls it “Time-Scale”, ha!). No need to waste a lot of rows as placeholders.
– Jon
I’ve searched the web and cannot find the answer to why I am suddenly getting on attempting to insert a new row: “The operation you are about to perform affects a large number of cells and may take a significant time to complete’. I have around 10,000 rows with about 10 columns with complex data in many rows. What is the limit anyone? have I reached it? Ta guys!
John: It sounds like the new Excel 2007 warning message. Because the grid got so big, they now warn you if you’re going to change some number of cells. Sorry I don’t know what that number is.