When the question is “What if”, the answer is a spreadsheet. That’s what they were made for: changing variables to see different results. Excel provides a seemingly little used tool called a data table that does just these types of “what if” scenarios.
This post deals with single-variable data tables. Let’s start with a couple of “constant” values that well use in our table. These values could be hard coded in the formulas that we’ll create later, but it’s nice for the user to see all the information, so we’ll put these values in cells outside the data table. We’ll also set up some column headings.

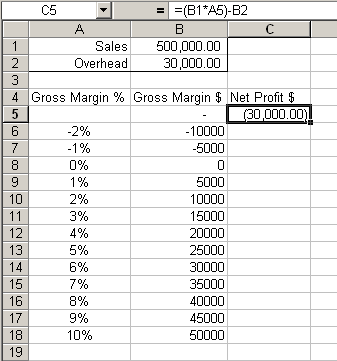
Cell A5 will be the input cell. You can use any cell, either within or outside of the data table. I generally use the cell directly above the substitution data. Enter the substitution data starting in A6. In this example I entered profit margin percentages from -2% to 10%.
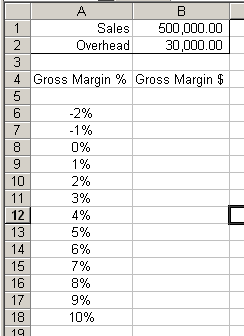
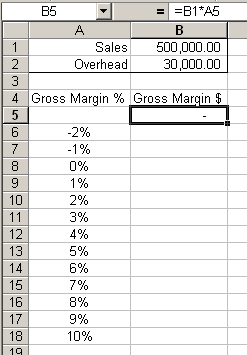
The gross margin percentages is the data that will be substituted into the formula that we will be creating. It is the “what if” part as in “what if the gross margin percent was 2%”. The results of the table will be in the column next to the substitution data. To define the results, we must create a formula that includes the input cell (remember we said that A5 would be our input cell and we left it blank for that reason). The formula goes one cell up and one cell to the right of the first piece of substitution data. Since our substitution data starts in A6, the formula goes in B5.
We’ve defined the formula and the changing data. All that’s left is to define the input cell. From the Data menu, choose Table. Define the input cell when prompted and you’re done. Since our substitution data is in a column, define the “Column Input Cell” not the “Row Input Cell”. In this screen shot, I’ve selected the data table and selected Data>Table.
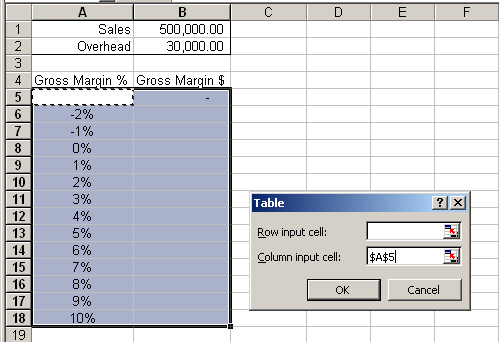
Click OK and the data table fills in all the answers.
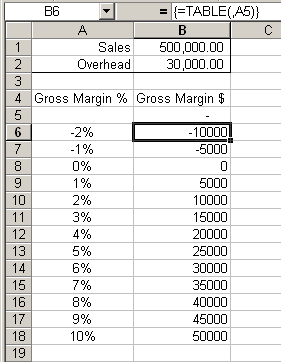
Next, we can add another column to the table. We could have done this right from start, but I thought it would be more illustrative this way. Add a new column heading and a new formula to compute the net profit. The new formula will go in C5. All formulas must reference the input cell, so we have a little repetition in our formula.
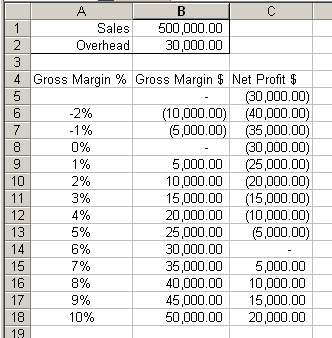
Select the new expanded table and repeat the Data>Table steps defining A5 as the input cell. With a little formatting added, we can see that 6% gross margin is our break even.
Data Tables
Excel Up one side
I can never remember how to do these tables. They seem useful, but by the time I remember how to set one up, I could have done it with regular worksheet formulas.
Is there any benefit (speed, file size, whatever) to using data tables instead of a grid of formulas?
– Jon
Jon: I haven’t tested it, but I’d bet it’s slightly slower than regular worksheet formulas. I say that because it seems there would be an extra step of finding the formula before evaluating it. However, maybe having it in a table increases the effeciency of the calc tree somehow. To the extent that I use them, I haven’t seen a noticeable difference.
I basically use them for testing. If I write a fairly complex formula (that I think is correct) I test it with a lot of values, especially the extreme values to see if I missed anything.
I think it’s one of those features that you have to force yourself to use for a month, even though it takes a little more work (e.g. remembering). Once you use it for a while, you’ll start using it more often.
This is very good. I often wondered if the data input table could be used besides only interest calculations. Thank you. Keep up the good work.
For more complex spreadsheets data tables are a godsend as duplication may not be practical or even possible.
For example, in financial models, data tables provide a quick approach to test different prices, foreign exchange, cost and tax assumptions. In my models I now link up a series of data tables to a “tornado” chart so that all the model sensitivies are shown instantly on a graph, and all update if the model structure changes
The drawback to data tables is the recalculation overhead and the fact that they can’t be copied and pasted elsewhere as live tables. While calcuation can be set to “Automatic except tables” some Excel addin software such as the monte carlo addin, Crystal Ball, will trigger a full calculation of any data tables each time Crytal Ball runs.
I ended up writing code to delete and then fully restore data tables to handle these issue. I’m happy to share it if anyone is interested.
Is there any way to make the “Automatic except tables” setting universal? I have tried changing the setting on Book.xlt and Sheet.xlt, adding AutoExec macros to both:
Application.Calculation = xlSemiautomatic
…adding a separate file to XLSTART with a similar AutoExec, adding the setting to AutoExec in the target files, and so on. The setting keeps reverting back to automatic. Help!!!
I think they are great but I had some funny behaviour from them. Try a simple Example 3 cells 2 inputs and one result. A1= 10 A2 = 20 A3 Formula = A1+A2
=30 then build a table where there are options so 10 could be 10 or 15 and 20 could be 20 or 25. So far so good.
10Input
20Input
30Formula
302025 Data Table
103035
153540
Then try linking the input where you typed to 10 back to A1 and the input you typed 20 in from A2. All of a sudden things started acting up an funny numbers appeared…. Looks like they need a bit more practice.
10Input
20Input
30Formula
302025 Same Data Table
103035
152540
The maths seems a bit bizzare?
If anyone can come up with a method for cleanly linking a data table to a constant on another sheet I will be most grateful. I want to link the data table row and column inputs to constants on another sheet. Is this possible in some obscure way? Or has anyone successfully reproduced the data table tool in VBA? Could please shed some light? Thanks in advance.
Yes, data tables can be a very powerful construct. In fact, if one looks at how they are implemented it will quickly become apparent that MS broke its own rules about what a function is allowed to do. Once you specify that a range contains a table, you will notice that the cells in that range contain an array formula, TABLE(). Of course, the implementation of a data table requires that XL change the value of one (or two) cells in the worksheet, recalc the worksheet and then update the value in the data table cell. Try doing that with a regular function (or a UDF)!
For my doctorate, I used data tables extensively for analysis where algebraic analysis fell short. For example, in a real options model to evaluate a monopolist’s investment opportunity, the first order derivative took a *complete* 8-1/2 x 11 page to write out. There was no way I could possibly analyze the equation and reach any meaningful conclusion. So, I resorted to numerical analysis and data tables.
The analysis quickly ran into various limits of the data table. One of the capabilities required was to run a macro before computing the value for each cell in the table. Basically, this would allow one to carry out an optimization as part of the table calculation. Another very useful capability would be the ability to specify a vector of values, not just a single row (or column value). Basically, I wanted not just r1, r2, etc. going down the rows in a single column but a vector such as (a1,b1), (a2, b2), etc. going down the rows in 2 (or more) columns.
The result was a homegrown add-in called SuperTable. After completing the dissertation I figured I’d make it available to the world at large. In the process of cleaning it up and making it presentable, I also enhanced it to be more flexible. I also tried to figure out how to make it work like XL’s TABLE() function. That was a mistake. While it still works, it’s very, very difficult to document. So, I put it aside.
Every so often, I open the file and wonder what I can do to clean it up and post on my website. Maybe, some day…
One way to use multiple input values in a data table is to insert a column index
and then use a lookup function in the table formula.
The example below calculates the IRR for three input columns:
ABCDE
————————————-
costYear1Year21internal rate of return
2=IRR(INDEX(A:C,D2,))
-2000011000120003=TABLE(,D2)
-3000015000180004=TABLE(,D2)
…
The table range is D2:E4 with D2 as column input cell. Column D and row 2 can be hidden.
In this simple exampleno data table is needed, of course, but the method extends to more complex models.
Example above with tabs replaced by semicolons:
—-
cost;Year1;Year2;1;internal rate of return
;;;2;=IRR(INDEX(A:C,D2,))
-20000;11000;12000;3;=TABLE(,D2)
-30000;15000;18000;4;=TABLE(,D2)
For a comprehensive explanation and example of data tables, look at this page on Dermot Balson’s Modelling Excel web site:
http://www.westnet.net.au/balson/ModellingExcel/LookMaNoCode.shtml
I’m finally convinced.
Greetings – I have forgotten how to do something in excel. I want to show the effects of changing an assumption on a range of resulting data. Specifically I have a key variable that drives revenue and I want to show the result in a 5 year P&L based on various values of the key variable
Key
Variable Year 1 Year 2 Year 3 Year 4 Year f
100
125
150
175
200 as so on
I belive there is also a table where you can have a changed various on a column and row and in the result quadrant underneath have a single result cell displayed that correlates to both.
Any help you can give on these two tables would be very much appreciated or directing me to a source.
Thanks so much
I can’t seem to see what the advantage is over doing the calculation with proper cell referencing (absolute, relative or mixed) and then copy paste……
While appealing in small simple models with very short calculation chains, data tables really do slow models down dramatically. In many cases, the tables we see are performing a relatively simple sensitivity analysis, with one or two inputs from the rest of the model, but each scenario takes a full recalculation of the precedent chain. Two solutions:- don’t use them in complex model; or move the table to another spreadsheet that links back to the precedents using named ranges – this can easily be opened, updated, and calculated in isolation.
Well, that’s completely wrong for Excel 2010. BTW, your screen shot is blank. Did you proof this ? Pretty poor presentation, dude.
Apparently not well enough. I fixed the link to the screenshot, so that should be working now. As for updating posts from 2004 to be Excel 2010 compliant… I guess I could issue a disclaimer that six year old posts may not work on six month old software, but you’re the first to complain about it.