Option Explicit
Sub Call_UnPivot()
UnPivot
End Sub
Function unpivot(Optional rngCrossTab As Range, _
Optional rngLeftHeaders As Range, _
Optional rngRightHeaders As Range, _
Optional strCrosstabName As String, _
Optional rngOutput As Range, _
Optional bSkipBlanks As Boolean = False) As Boolean
' Desc: Turns a crosstab file into a flatfile using array manipulation.
' If the resulting flat file will be too long to fit in the worksheet,
' the routine uses SQL and lots of 'UNION ALL' statements to do the
' equivalent of the 'UNPfaddIVOT' command in SQL Server (which is not available
' in Excel)and writes the result directly to a PivotTable
' Base code for the SQL UnPivot derived from from Fazza at MR EXCEL forum:
' http://www.mrexcel.com/forum/showthread.php?315768-Creating-a-pivot-table-with-multiple-sheets
' The Microsoft JET/ACE Database engine has a hard limit of 50 'UNION ALL' clauses, but Fazza's
' code gets around this by creating sublocks of up to 25 SELECT/UNION ALL statements, and
' then unioning these.
' Programmer: Jeff Weir
' Contact: weir.jeff@gmail.com
' Name/Version: Date: Ini: Modification:
' UnPivot V1 20131122 JSW Original Development
' Inputs: Range of the entile crosstab
' Range of columns down the left that WON'T be normalized
' Range of columns down the right that WILL be normalize
' String containing the name to give columns that will be normalized
' Outputs: A pivottable of the input data on a new worksheet.
' Example:
' It takes a crosstabulated table that looks like this:
' Country Sector 1990 1991 ... 2009
' =============================================================================
' Australia Energy 290,872 296,887 ... 417,355
' New Zealand Energy 23,915 25,738 ... 31,361
' United States Energy 5,254,607 5,357,253 ... 5,751,106
' Australia Manufacturing 35,648 35,207 ... 44,514
' New Zealand Manufacturing 4,389 4,845 ... 4,907
' United States Manufacturing 852,424 837,828 ... 735,902
' Australia Transport 62,121 61,504 ... 83,645
' New Zealand Transport 8,679 8,696 ... 13,783
' United States Transport 1,484,909 1,447,234 ... 1,722,501
' And it returns the same data in a recordset organised like this:
' Country Sector Year Value
' ====================================================
' Australia Energy 1990 290,872
' New Zealand Energy 1990 23,915
' United States Energy 1990 5,254,607
' Australia Manufacturing 1990 35,648
' New Zealand Manufacturing 1990 4,389
' United States Manufacturing 1990 852,424
' Australia Transport 1990 62,121
' New Zealand Transport 1990 8,679
' United States Transport 1990 1,484,909
' Australia Energy 1991 296,887
' New Zealand Energy 1991 25,738
' United States Energy 1991 5,357,253
' Australia Manufacturing 1991 35,207
' New Zealand Manufacturing 1991 4,845
' United States Manufacturing 1991 837,828
' Australia Transport 1991 61,504
' New Zealand Transport 1991 8,696
' United States Transport 1991 1,447,234
' ... ... ... ...
' ... ... ... ...
' ... ... ... ...
' Australia Energy 2009 417,355
' New Zealand Energy 2009 31,361
' United States Energy 2009 5,751,106
' Australia Manufacturing 2009 44,514
' New Zealand Manufacturing 2009 4,907
' United States Manufacturing 2009 735,902
' Australia Transport 2009 83,645
' New Zealand Transport 2009 13,783
' United States Transport 2009 1,722,501
Const lngMAX_UNIONS As Long = 25
Dim varSource As Variant
Dim varOutput As Variant
Dim lLeftColumns As Long
Dim lRightColumns As Long
Dim i As Long
Dim j As Long
Dim m As Long
Dim n As Long
Dim lOutputRows As Long
Dim arSQL() As String
Dim arTemp() As String
Dim sTempFilePath As String
Dim objPivotCache As PivotCache
Dim objRS As Object
Dim oConn As Object
Dim sConnection As String
Dim wks As Worksheet
Dim wksNew As Worksheet
Dim cell As Range
Dim strLeftHeaders As String
Dim wksSource As Worksheet
Dim pt As PivotTable
Dim rngCurrentHeader As Range
Dim timetaken As Date
Dim strMsg As String
Dim varAnswer As Variant
Const Success As Boolean = True
Const Failure As Boolean = False
unpivot = Failure
'Identify where the ENTIRE crosstab table is
If rngCrossTab Is Nothing Then
Application.ScreenUpdating = True
On Error Resume Next
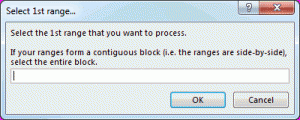
Set rngCrossTab = Application.InputBox( _
Title:="Please select the ENTIRE crosstab", _
Prompt:="Please select the ENTIRE crosstab that you want to turn into a flat file", _
Type:=8, Default:=Selection.CurrentRegion.Address)
If Err.Number <> 0 Then
On Error GoTo ErrHandler
Err.Raise 999
Else: On Error GoTo ErrHandler
End If
rngCrossTab.Parent.Activate
rngCrossTab.Cells(1, 1).Select 'Returns them to the top left of the source table for convenience
End If
'Identify range containing columns of interest running down the table
If rngLeftHeaders Is Nothing Then
On Error Resume Next
Set rngLeftHeaders = Application.InputBox( _
Title:="Select the column HEADERS from the LEFT of the table that WON'T be aggregated", _
Prompt:="Select the column HEADERS from the LEFT of the table that won't be aggregated", _
Default:=Selection.Address, Type:=8)
If Err.Number <> 0 Then
On Error GoTo ErrHandler
Err.Raise 999
Else: On Error GoTo ErrHandler
End If
Set rngLeftHeaders = rngLeftHeaders.Resize(1, rngLeftHeaders.Columns.Count) 'just in case they selected the entire column
Range(rngLeftHeaders.Cells(1, rngLeftHeaders.Columns.Count + 1), rngLeftHeaders.Cells(1, rngLeftHeaders.Columns.Count + 1).End(xlToRight)).Select 'Returns them to the right of the range they just selected
End If
If rngRightHeaders Is Nothing Then
'Identify range containing data and cross-tab headers running across the table
On Error Resume Next
Set rngRightHeaders = Application.InputBox( _
Title:="Select the column HEADERS from the RIGHT of the table that WILL be aggregated", _
Prompt:="Select the column HEADERS from the RIGHT of the table that WILL be aggregated", _
Default:=Selection.Address, _
Type:=8)
If Err.Number <> 0 Then
On Error GoTo ErrHandler
Err.Raise 999
Else: On Error GoTo ErrHandler
End If
Set rngRightHeaders = rngRightHeaders.Resize(1, rngRightHeaders.Columns.Count) 'just in case they selected the entire column
rngCrossTab.Cells(1, 1).Select 'Returns them to the top left of the source table for convenience
End If
If strCrosstabName = "" Then
'Get the field name for the columns being consolidated e.g. 'Country' or 'Project'. note that reserved SQL words like 'Date' cannot be used
strCrosstabName = Application.InputBox( _
Title:="What name do you want to give the data field being aggregated?", _
Prompt:="What name do you want to give the data field being aggregated? e.g. 'Date', 'Country', etc.", _
Default:="Date", _
Type:=2)
If strCrosstabName = "False" Then Err.Raise 999
End If
If rngOutput Is Nothing Then
'Identify range containing data and cross-tab headers running across the table
On Error Resume Next
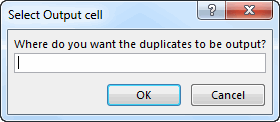
Set rngOutput = Application.InputBox( _
Title:="Where do you want to output the data", _
Prompt:="Select the top left cell where you want the transformed data to be output", _
Default:=Cells(ActiveSheet.UsedRange.row, ActiveSheet.UsedRange.Columns.Count + ActiveSheet.UsedRange.Column + 1).Address, _
Type:=8)
If Err.Number <> 0 Then
On Error GoTo ErrHandler
Err.Raise 999
Else: On Error GoTo ErrHandler
End If
End If
timetaken = Now()
Application.ScreenUpdating = False
'Work out if the worksheet has enough rows to fit a crosstab in
If Intersect(rngRightHeaders.EntireColumn, rngCrossTab).Cells.Count <= Columns(1).Rows.Count Then
'Resulting flat file will fit on the sheet, so use array manipulation.
varSource = rngCrossTab
lRightColumns = rngRightHeaders.Columns.Count
lLeftColumns = UBound(varSource, 2) - lRightColumns
If Not bSkipBlanks Then
ReDim varOutput(1 To lRightColumns * (UBound(varSource) - 1), 1 To lLeftColumns + 2)
Else
lOutputRows = Application.WorksheetFunction.CountA(Intersect([appRightHeaders].EntireColumn, rngCrossTab)) - [appRightHeaders].Cells.Count
ReDim varOutput(1 To lOutputRows, 1 To lLeftColumns + 2)
End If
If Not bSkipBlanks Then
For j = 1 To UBound(varOutput)
m = (j - 1) Mod (UBound(varSource) - 1) + 2
n = (j - 1) \ (UBound(varSource) - 1) + lLeftColumns + 1
varOutput(j, lLeftColumns + 1) = varSource(1, n)
varOutput(j, lLeftColumns + 2) = varSource(m, n)
For i = 1 To lLeftColumns
varOutput(j, i) = varSource(m, i)
Next i
Next j
Else
lOutputRows = 1
For j = 1 To Intersect([appRightHeaders].EntireColumn, rngCrossTab).Cells.Count - [appRightHeaders].Cells.Count
m = (j - 1) Mod (UBound(varSource) - 1) + 2
n = (j - 1) \ (UBound(varSource) - 1) + lLeftColumns + 1
If Not IsEmpty(varSource(m, n)) Then
varOutput(lOutputRows, lLeftColumns + 1) = varSource(1, n)
varOutput(lOutputRows, lLeftColumns + 2) = varSource(m, n)
For i = 1 To lLeftColumns
varOutput(lOutputRows, i) = varSource(m, i)
Next i
lOutputRows = lOutputRows + 1
End If
Next j
End If
With rngOutput
.Resize(, lLeftColumns).Value = rngLeftHeaders.Value
.Offset(, lLeftColumns).Value = strCrosstabName
.Offset(, lLeftColumns + 1).Value = "Quantity"
.Offset(1, 0).Resize(UBound(varOutput), UBound(varOutput, 2)) = varOutput
End With
Else 'Resulting flat file will fit on the sheet, so use SQL and write result directly to a pivot
strMsg = " I can't turn this crosstab into a flat file, because the crosstab is so large that"
strMsg = strMsg & " the resulting flat file will be too big to fit in a worksheet. "
strMsg = strMsg & vbNewLine & vbNewLine
strMsg = strMsg & " However, I can still turn this information directly into a PivotTable if you want."
strMsg = strMsg & " Note that this might take several minutes. Do you wish to proceed?"
varAnswer = MsgBox(Prompt:=strMsg, Buttons:=vbOK + vbCancel + vbCritical, Title:="Crosstab too large!")
If varAnswer <> 6 Then Err.Raise 999
If ActiveWorkbook.Path <> "" Then 'can only proceed if the workbook has been saved somewhere
Set wksSource = rngLeftHeaders.Parent
'Build part of SQL Statement that deals with 'static' columns i.e. the ones down the left
For Each cell In rngLeftHeaders
'For some reason this approach doesn't like columns with numeric headers.
' My solution in the below line is to prefix any numeric characters with
' an apostrophe to render them non-numeric, and restore them back to numeric
' after the query has run
If IsNumeric(cell) Or IsDate(cell) Then cell.Value = "'" & cell.Value
strLeftHeaders = strLeftHeaders & "[" & cell.Value & "], "
Next cell
ReDim arTemp(1 To lngMAX_UNIONS) 'currently 25 as per declaration at top of module
ReDim arSQL(1 To (rngRightHeaders.Count - 1) \ lngMAX_UNIONS + 1)
For i = LBound(arSQL) To UBound(arSQL) - 1
For j = LBound(arTemp) To UBound(arTemp)
Set rngCurrentHeader = rngRightHeaders(1, (i - 1) * lngMAX_UNIONS + j)
arTemp(j) = "SELECT " & strLeftHeaders & "[" & rngCurrentHeader.Value & "] AS Total, '" & rngCurrentHeader.Value & "' AS [" & strCrosstabName & "] FROM [" & rngCurrentHeader.Parent.Name & "$" & Replace(rngCrossTab.Address, "$", "") & "]"
If IsNumeric(rngCurrentHeader) Or IsDate(rngCurrentHeader) Then rngCurrentHeader.Value = "'" & rngCurrentHeader.Value 'As per above, can't have numeric headers
Next j
arSQL(i) = "(" & Join$(arTemp, vbCr & "UNION ALL ") & ")"
Next i
ReDim arTemp(1 To rngRightHeaders.Count - (i - 1) * lngMAX_UNIONS)
For j = LBound(arTemp) To UBound(arTemp)
Set rngCurrentHeader = rngRightHeaders(1, (i - 1) * lngMAX_UNIONS + j)
arTemp(j) = "SELECT " & strLeftHeaders & "[" & rngCurrentHeader.Value & "] AS Total, '" & rngCurrentHeader.Value & "' AS [" & strCrosstabName & "] FROM [" & rngCurrentHeader.Parent.Name & "$" & Replace(rngCrossTab.Address, "$", "") & "]"
If IsNumeric(rngCurrentHeader) Or IsDate(rngCurrentHeader) Then rngCurrentHeader.Value = "'" & rngCurrentHeader.Value 'As per above, can't have numeric headers
Next j
arSQL(i) = "(" & Join$(arTemp, vbCr & "UNION ALL ") & ")"
'Debug.Print Join$(arSQL, vbCr & "UNION ALL" & vbCr)
'''''''''''''''''''''''''''''''''''''''''''''''''''''''''''''''''
' When using ADO with Excel data, there is a documented bug
' causing a memory leak unless the data is in a different
' workbook from the ADO workbook.
' http://support.microsoft.com/kb/319998
' So the work-around is to save a temp version somewhere else,
' then pull the data from the temp version, then delete the
' temp copy
sTempFilePath = ActiveWorkbook.Path
sTempFilePath = sTempFilePath & "\" & "TempFile_" & Format(Time(), "hhmmss") & ".xlsm"
ActiveWorkbook.SaveCopyAs sTempFilePath
'''''''''''''''''''''''''''''''''''''''''''''''''''''''''''''''''
If Application.Version >= 12 Then
'use ACE provider connection string
sConnection = "Provider=Microsoft.ACE.OLEDB.12.0; Data Source=" & sTempFilePath & ";Extended Properties=""Excel 12.0;"""
Else
'use JET provider connection string
sConnection = "Provider=Microsoft.Jet.OLEDB.4.0; Data Source=" & sTempFilePath & ";Extended Properties=""Excel 8.0;"""
End If
Set objRS = CreateObject("ADODB.Recordset")
Set oConn = CreateObject("ADODB.Connection")
' Open the ADO connection to our temp Excel workbook
oConn.Open sConnection
' Open the recordset as a result of executing the SQL query
objRS.Open Source:=Join$(arSQL, vbCr & "UNION ALL" & vbCr), ActiveConnection:=oConn, CursorType:=3 'adOpenStatic !!!NOTE!!! we have to use a numerical constant here, because as we are using late binding Excel doesn't have a clue what 'adOpenStatic' means
Set objPivotCache = ActiveWorkbook.PivotCaches.Create(xlExternal)
Set objPivotCache.Recordset = objRS
Set objRS = Nothing
Set pt = objPivotCache.CreatePivotTable(TableDestination:=rngOutput)
Set objPivotCache = Nothing
'Turn any numerical headings back to numbers by effectively removing any apostrophes in front
For Each cell In rngLeftHeaders
If IsNumeric(cell) Or IsDate(cell) Then cell.Value = cell.Value
Next cell
For Each cell In rngRightHeaders
If IsNumeric(cell) Or IsDate(cell) Then cell.Value = cell.Value
Next cell
With pt
.ManualUpdate = True 'stops the pt refreshing while we make chages to it.
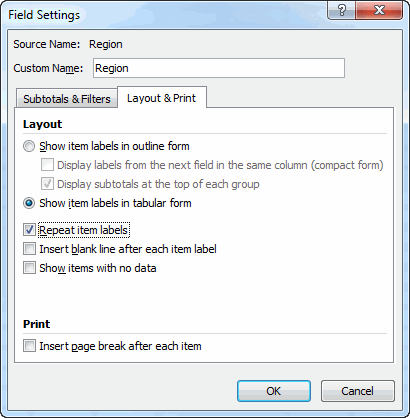
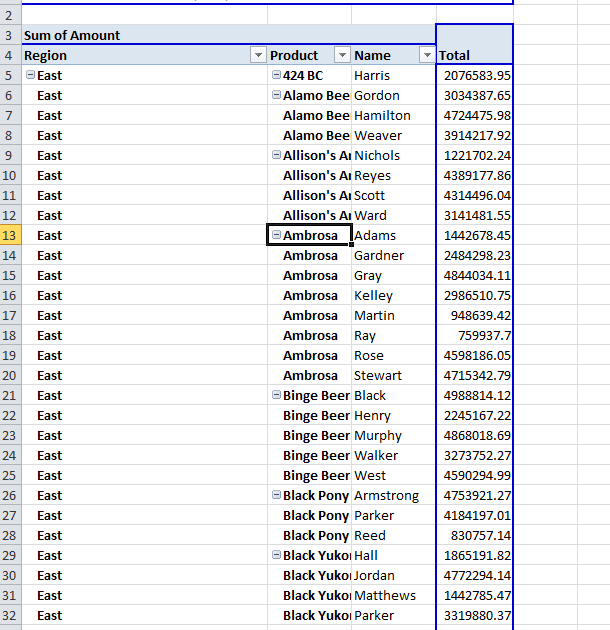
If Application.Version >= 14 Then TabularLayout pt
For Each cell In rngLeftHeaders
With .PivotFields(cell.Value)
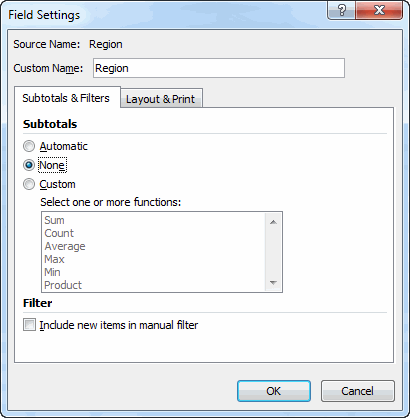
.Subtotals = Array(False, False, False, False, False, False, False, False, False, False, False, False)
End With
Next cell
With .PivotFields(strCrosstabName)
.Subtotals = Array(False, False, False, False, False, False, False, False, False, False, False, False)
End With
With .PivotFields("Total")
.Orientation = xlDataField
.Function = xlSum
End With
.ManualUpdate = False
End With
Else: MsgBox "You must first save the workbook for this code to work."
End If
End If
unpivot = Success
timetaken = timetaken - Now()
Debug.Print "UnPivot: " & Now() & " Time Taken: " & Format(timetaken, "HH:MM:SS")
ErrHandler:
If Err.Number <> 0 Then
Select Case Err.Number
Case 999: 'User pushed cancel.
Case Else: MsgBox "Whoops, there was an error: Error#" & Err.Number & vbCrLf & Err.Description _
, vbCritical, "Error", Err.HelpFile, Err.HelpContext
End Select
End If
Application.ScreenUpdating = True
End Function
Private Sub TabularLayout(pt As PivotTable)
With pt
.RepeatAllLabels xlRepeatLabels
.RowAxisLayout xlTabularRow
End With
End Sub
