Excel Mashup #2

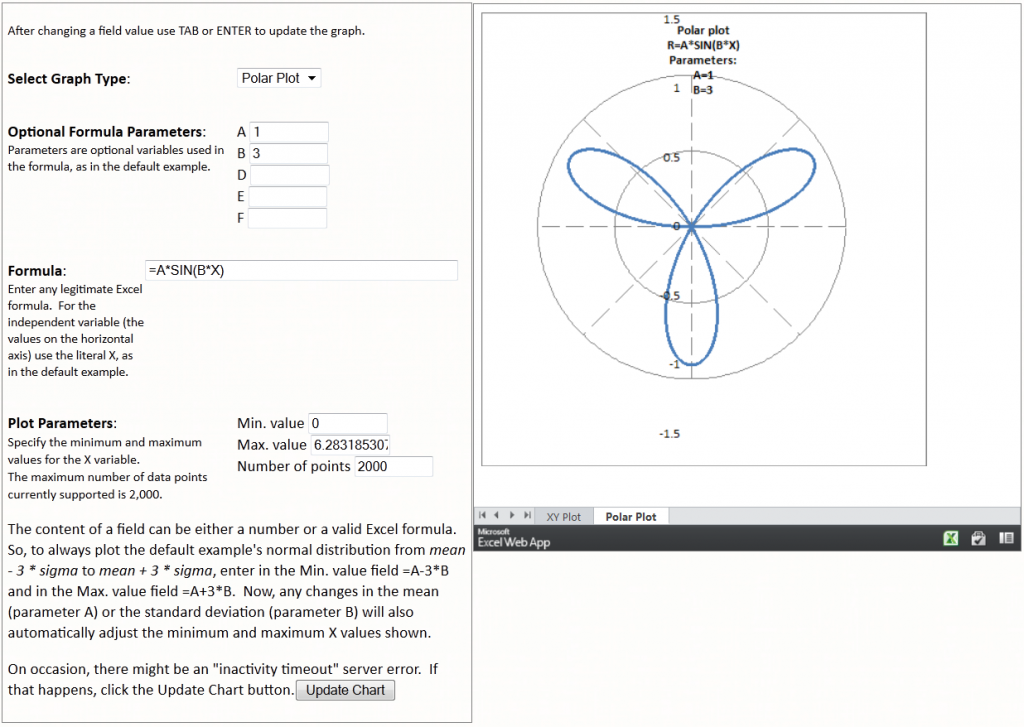
Following up on the previous post (http://www.dailydoseofexcel.com/archives/2012/01/25/excel-mashup-1/) I extended the capability to create a Polar plot using a 2nd worksheet in the same workbook. The consumer provides graph parameters, including the graph type, using HTML form controls. The graph is in an Excel workbook.

Graph any Excel formula in a XY (Cartesian) chart or a Polar plot

Excel Mashup #1

Recently, Microsoft introduced a way to create a “mashup” using Excel. Fellow MVP, Jan Karel, put together a tutorial on how he created his first mashup. It helped me understand the basics, which are also well explained by Microsoft itself.

In my case, for a long, long time I have wanted to draw any graph on a web page and do so easily. Some years back Google introduced an API that I experimented with but it never caught my fancy.

So, here’s my attempt with JavaScript and MS Excel. Of course, Microsoft has a less than stellar history on web-based Excel/Office products (Office Web Components comes to mind). But, maybe, this time around it will be different, given the push that the company as a whole is making for web-centric products.

Graph any Excel formula as a function of a single variable

I will post a “how I did it” article in a day or two together with links to whatever documentation / samples I could find on the ‘Net.

Does the location of a formula affect its accuracy?

Someone in Microsoft’s Excel forum had a question for which I don’t have an adequate response.

In A2:A7 enter the values:
6494.55
1311.36
198.08
124.9
131.81
131.81

In A1 sum the values with =SUM(A2:A7)

In A9 compute the same result by double counting all the values and subtracting the total, i.e., =SUM(A1:A7)-A1

In A10 check if A1 and A9 are the same. =A9=A1. The result is FALSE, i.e., they are not the same.

8392.51
6494.55
1311.36
198.08
124.9
131.81
131.81

8392.51
FALSE

Turns out that A9 has a 1 in the 11th decimal place. 8392.510000000010

Fair enough. There’s the 15 digits of accuracy thing going on and we have a rounding error.

Now, build the same model except this time put the A1 formula in A8 (and adjust A9 and A10 accordingly). The result is A10 shows TRUE!

6494.55
1311.36
198.08
124.9
131.81
131.81
8392.51
8392.51
TRUE

As far as rounding errors go, there isn’t one. This time A9 contains 8392.510000000000

Like I wrote at the beginning. I don’t know why the two models yield different results.

No more Google Adsense ads on my website – at least for now

For several years now, Google has shown ads on my website and when someone clicked on one of the ads, it shared with me some of the revenue it earned.  For some time now I have had the impression that the Adsense revenues have been in decline – mine, not Google’s. {grin}

So, earlier this week I analyzed the performance of my Adsense account and concluded that it no longer made sense to show these ads.  This post discusses my analysis and the role of Excel in it.

The data from Adsense system included, on a month-by-month basis, information on number of ads shown, number of clicks, and revenue (for me, not Google).  It also included derived information such as the revenue per click, called Cost-per-click, or CPC, and the conversion rate (clicks/ads shown).  Of course the last two are easily computed from the first three data items.

Before going further, it might help to understand the different drivers of Adsense revenue.  I thought of 3 key elements:

1) The kind of ad Google shows.  It has to be relevant to the website visitor.

2) The number of times a website visitor clicks on an ad, and

3) The amount that Google pays me for the click.

Interestingly enough, the website owner has no control over any of those elements!

OK, back to the Adsense data.  Google Adsense has an option to download the data in CSV format.  So, after downloading into Excel, I “normalized” the data so that all the numbers for January 2006 were 100.  This had two effects: one could look at large numbers and small numbers in the same visual space, thus making trend comparison easier, and it masked the actual data.

[A technical note.  The month column included the start and end date of each month, e.g., 2006-01-01 – 2006-01-31.  So, I added a new column to get a month as Excel understands it, using the formula =DATEVALUE(LEFT(B4,FIND(” “,B4)-1)), and formatted it to show only yyyy-mm.]

Next, I created a PivotTable and PivotChart showing on a month-by-month basis the number of views, clicks, and revenue over time.  Since Google provided data for two products (Adsense for Content and Adsense for Search), I filtered the PT to show only Adsense for Content.

As Figure 1 shows, the views (in blue) have gone up while the clicks (in red) and revenue (in green) have dropped.  So, this makes it evident that item 2 above (number of clicks) has not fared well over the years.


Figure 1

Out of curiosity, I decided to check if the revenues-per-click (my share of what the advertisers paid Google) had changed over the years.  As Figure 2 shows, item 3 in the list above (the amount Google paid me per click) remained steady until early 2009, dropped in 2009 and the first half of 2010, rose in the latter half of 2010 to 2.5 times the 2006 level and remained steady through 2011.

Of course, since the total revenue continued to drop, it must mean that the drop in the number of clicks was far greater than the increase in the CPC.


Figure 2

To test item 1 in the list above (relevance of ads), I checked 3 pages at random.  The results were, frankly, surprising.  Given Google’s reputation of delivering accurate search results, I would expect website ads to be related to the website content.  That, amazingly enough, was not the case.

On a page that explains supply and demand curves, there were ads for power tools and plastic enclosures.


Figure 3

On the TM AutoChart page there were ads for “Find Autos Near You” and project management software.


Figure 4

And, on the TM Randomize Slideshow page there were ads for Google Chrome, Microsoft Private Cloud, reverse look up of cell phone numbers, and a network monitor.


Figure 5

I am sure the relevance of the ads to the website content must make sense to Google’s Adsense algorithms but it surely escapes me.

In any case, I decided to pull the Adsense ads, at least temporarily.
 

List all folders in a Microsoft Outlook account

Recently, I wanted to create a list of all the folders in my MS Outlook PST file together with the size of each folder. Outlook provides that information through the user interface. Unfortunately, it shows the result in a modal dialog with no way to save the information elsewhere. So, I decided to check if I could find some ready-to-use (or nearly ready-to-use) code that did the needful. A search of the web led to several ideas and suggestions but no code to do the needful. So, I decided to put together a VBA module that would save the information in an Excel worksheet.

For a version in a page by itself (i.e., not in a scrollable iframe as below) visit http://www.tushar-mehta.com/publish_train/xl_vba_cases/1201%20Outlook%20folder%20info.shtml

Tushar Mehta

Protect a global variable in another VB project

Developers who have done any kind of programming with the Office 2007 (and later) Ribbon architecture have encountered almost certainly a scenario that resulted in the loss of their pointer to the ribbon. This happens because the ribbon object has to be stored in a global variable and any kind of unhandled error leads to a “loss of state,” which includes the loss of all global variables.

In http://www.dailydoseofexcel.com/archives/2011/08/14/save-a-global-variable-in-an-excel-workbook/ I describe a way, first proposed by Rory Archibald, to save the handle to an object in an Excel cell (or named constant). That is an easy to implement and relatively self-contained approach.

At the same time, I wanted a solution that worked not only with Excel but also other applications such as PowerPoint and Word. I also wanted a solution that worked with variables other than objects declared outside of the VBA project. Consequently, I opted to use a separate add-in that did nothing more than save global variables in a VBA collection. While this requires coordination between two add-ins, the benefits include the ability to extend the solution to platforms other than Excel, the ability to save the state of any global, and also a solution that does not require a Windows API. This note documents such an approach.

For a version in a page by itself (i.e., not in a scrollable iframe as below) visit http://www.tushar-mehta.com/publish_train/xl_vba_cases/1018%20Protect%20a%20global%20variable%20in%20another%20VBProject.shtml

Tushar Mehta

In a class module, why use an unrestricted property?

Over the years, I have followed the “best practice” of always using a property get and let/set combination rather than just declaring a public variable. But, over the last few months I’ve started questioning this dictum.

Now, before people start jumping up and down, I am aware of the many very, very good reasons why one should use properties rather than public variables. This comment is *limited* to the case where the property provides unrestricted access to the underlying value.

For those who want a clarification of what I am writing about, in a class module, one could have either

Option Explicit

Public R As Single

or

Option Explicit

Dim xR As Single
Public Property Get R() As Single
    R = xR
    End Property
Public Property Let R(uR As Single)
    xR = uR
    End Property

As far as a consumer of this class goes, the code would be identical irrespective of which of the above methods the developer of the class used.

One could argue that at some point, the developer may want to enforce a check on R (e.g., enforce that R > 0). Or one might want to provide a property that is read-only or write-once-read-many or one of many other scenarios where a property Get / Let would be required. But, until that happens, what’s the difference whether the class developer uses an unrestricted property or a public variable?

Geocoding with Excel and VBA

Before one can position an address (a street address or a town itself) on a map, it must be converted to geographic coordinates (latitude and longitude). Then, that latitude and longitude is mapped to a particular location on the map. Figure 1 shows several thousand U.S. cities and towns on a Mercator projection map. Well, it’s actually an Excel XY Scatter chart made to look like a map of the U.S. It plots the crime rate for a specific crime for a specific year but that’s not the focus of this note. Here we focus on geocoding an address using Excel and VBA and plotting the resulting geographic coordinates (latitude and longitude) onto a map.

Figure 1 – This is a XY Scatter chart!

Figure 1 – This is a XY Scatter chart!

For a version in a page by itself (i.e., not in a scrollable iframe as below) visit http://www.tushar-mehta.com/publish_train/data_visualization/10a%20Dashboards-Geocoding.shtml

Tushar Mehta