Highlight row and column of active cell

By default, when the user selects a cell, Excel highlights the row and column by changing the color of the associated row and column headers. This tip shares multiple ways to highlight the row and column in more obvious ways as well as a way to highlight the cell in a specific column in the same row.


The emphasis is on the use of conditional formatting to accomplish the task. The minimal VBA code required to make it work is the same single executable statement for all of the different highlighting options!

For a version in a page by itself (i.e., not in a scrollable iframe as below) visit http://www.tushar-mehta.com/publish_train/xl_vba_cases/0121%20highlight%20row%20and%20col%20of%20selected%20cell.shtml

Tushar Mehta

In an userform list all available fonts

The motivation for this tip was to share how to

1) dynamically add controls to a userform
2) respond to events for these controls, and
3) specifically respond to events using a callback procedure that is located in another class module!

Since this may come across as a fairly technical topic, this tip utilizes the above capabilities to provide a functional solution:

1) list in an userform the names of all available fonts with each name shown using that font,
2) hover over the option button associated with a font to see a sample of every English keyboard character in that font,
3) click on the option button to select the font, and, finally,
4) use this capability to programmatically get the user’s selection, if any.

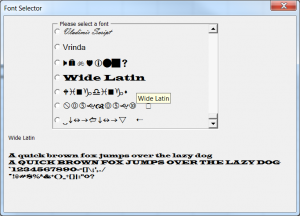
Below is an example of the font selector in action. Each OptionButton shows the name of one available font using the font itself. At the same time, the control tool tip shows the font name in English (see the Wide Latin tip). A sample of how every keyboard character will look in that font appears below the font selector frame.
The motivation for this example was a Daily Dose of Excel blog post by Michael (http://www.dailydoseofexcel.com/archives/2012/03/14/getting-a-font-list-to-a-combo-box-2/). He used a combo box to list the fonts available to Excel leveraging a technique shown in a tip by John Walkenbach (http://www.j-walk.com/ss/excel/tips/tip79.htm).

For a version in a page by itself (i.e., not in a scrollable iframe as below) visit http://www.tushar-mehta.com/publish_train/xl_vba_cases/1054%20show%20fonts%20in%20userform.shtml

Tushar Mehta

Introducing TM Retro Slicer

Those who have used a slicer in Excel 2010 slicer may want to see that capability in earlier versions of Excel. I like what Microsoft did with slicers in 2010 and have wanted to extend that capability backwards. For those who haven’t used a slicer, it is a filter on a particular pivot field shown as an independent object.

So, with TM Retro Slicer, one can create a slicer in any version of Excel from 2003 to 2010.

TM Retro Slicer works with versions of Excel from 2003 to 2010. Once enabled, a slicer will be visible on the worksheet.

Switching worksheets will hide the slicer and it will reappear when the worksheet is reactivated.

The slicer will remain across a workbook close and re-open.

For more on this shareware solution, please visit http://www.tushar-mehta.com/excel/software/retro_slicer/index.htm

Tushar Mehta

Introducing TM Match Target

The TM Match Target add-in analyzes a list of numbers and finds combinations that sum to a given total. This has applications in a range of disciplines including processing receipts, reconciling payments such as health care insurance reimbursements or payments by a customer for many outstanding invoices, operations management and operations research, and supply change management.

There are a number of posts, easily found through Google or Bing, that address the same issue, including my own Find a set of amounts that match a target value. This add-in packages the analysis in an easy-to-use interface, includes a means to stop the analysis if it is taking too long and preserve the combinations found so far, together with various options on what results should be shown.

For more please visit http://www.tushar-mehta.com/excel/software/match_target/.

Tushar Mehta

A winner of the Microsoft BI PowerView contest

Microsoft’s BI group is running a contest on using PowerView to answer business questions about one of its demo datasets. More than anything it’s knowing how to use the PowerView GUI to build the appropriate query because the winner is the first person to reply with the correct answer. In any case, I won today’s 4pm question.

Microsoft BI ‏ @MicrosoftBI
Congrats to @tusharm10 who is the final winner of the #MSPV contest today! Thank you everybody for playing; new set of questions coming Tue!

I wonder when (if?) PowerView will find its way to Excel.

For all the tweets regarding the contest search Twitter for #MSPV.

And, yes, to enter the contest I had to create a Twitter account. You can find me at @tusharm10

PowerView contest details:http://blogs.msdn.com/b/microsoft_business_intelligence1/archive/2012/02/16/the-power-view-contest-is-here.aspx

Tushar Mehta

TM Custom Radar Chart add-in

A Radar Chart, also known as a Spider Chart, visually compares several entities (products, organizations, investment opportunities, or even people) on multiple dimensions. For example, a manager of a diagnostic imaging (radiology) center might want to compare her facility with the competition on dimensions related to patients such as Time To Appointment, Report Turnaround Time, No Show Rate, and Wait Time.

Or, one might want to compare 6 products A, B, C, D, E, and F on 6 different attributes: Aesthetic Appeal, Compatibility, Strength, Market Size, Durability, and Reliability. The Custom Radar Chart lets one easily compare all the products along each of the dimensions on interest. This is the example used in the documentation. With the axes normalized, the resulting chart would be

For more on this shareware product, please visit www.tushar-mehta.com/excel/software/custom_radar/index.htm

Tushar Mehta

Creating an Excel Mashup

Following up on my previous posts sharing my initial Excel mashups (http://www.dailydoseofexcel.com/archives/2012/01/29/excel-mashup-2/ and http://www.dailydoseofexcel.com/archives/2012/01/25/excel-mashup-1/), this post shares the details of how I created the second mashup. It assumes a basic familiarity with C-style syntax, asynchronous processing, and callback functions.

For a version in a page by itself (i.e., not in a scrollable iframe as below) visit http://www.tushar-mehta.com/publish_train/data_visualization/15a%20Excel%20Mashup.shtml

Tushar Mehta