I love the Leader Lines that Excel 2013 puts in for you if you’re using Excel 2013 and you drag a datalabel somewhere. If you want to use Leader Lines in earlier versions, then they are only available if you use a pie chart. And we all know what Peltier would say about that, don’t we.
So I thought I’d have a crack at programatically adding leader lines to ‘Peltier-approved’ chart types via VBA shapes.
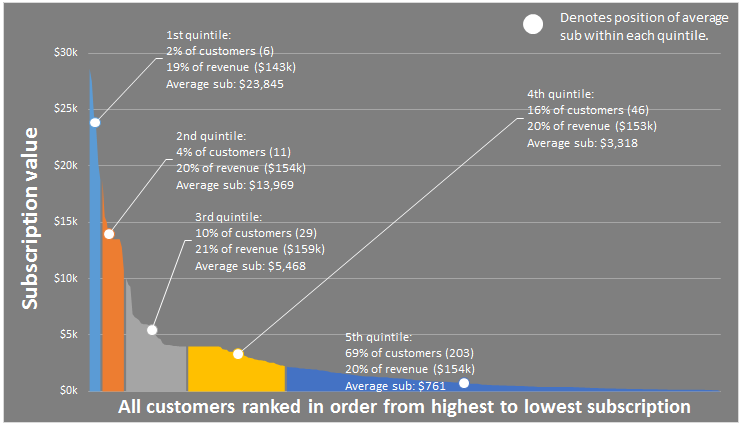
First, let’s look at what those native leader lines in Excel 2013 look like, eh?
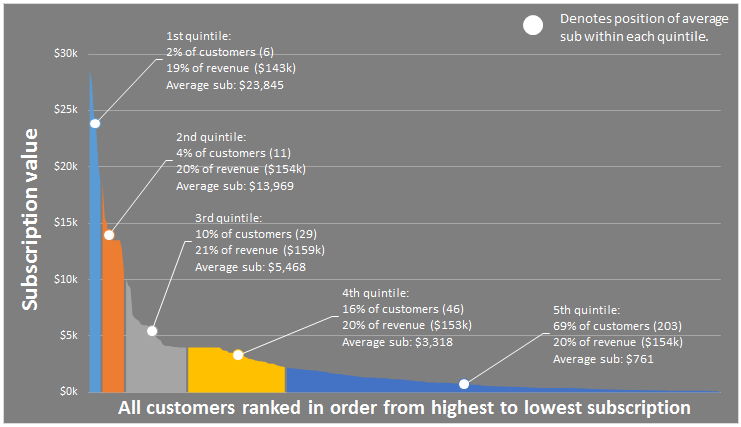
Ha! Fooled you…those are my programaticaly applied lines in Excel 2010.
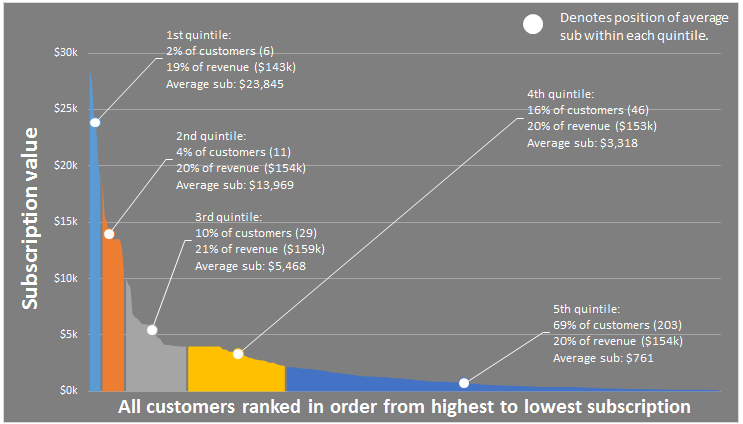
I added these via using a Freeform shape, and the code lives inside a Class Module, so that if you move a data label around, the leader line gets redrawn. For instance, let’s drag that 4th data label North-East:
Just like in Excel 2013, my routine intelligently connects the leader line to the appropriate side of the data label, depending on it’s position relative to the point it connects to. For instance, let’s park that 5th data label directly over the point it refers to:
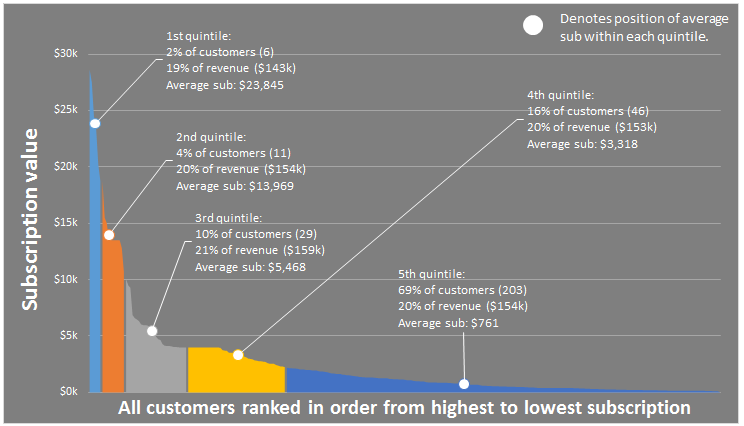
…and now let’s put it on the left:
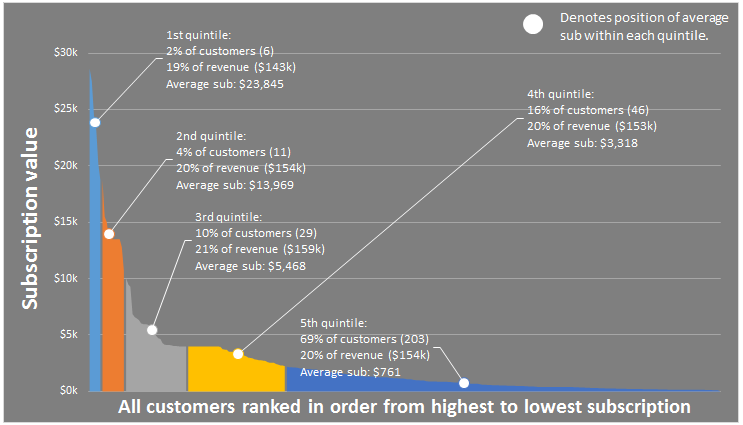
And if the data label obscures the point, no leader line is produced:
I used a Class Module to do this. In fact, this is the first Class Module I have ever written:
Option Explicit
Public WithEvents clsChart As Chart
Private Sub clsChart_Mouseup(ByVal Button As Long, ByVal Shift As Long, ByVal x As Long, ByVal y As Long)
Dim IDNum As Long
Dim a As Long
Dim b As Long
Dim shpLeaderLine As FreeformBuilder
Dim pt As Point
Dim lKink As Long
lKink = 5
Dim bLabel As Boolean
Dim shp As Shape
ActiveChart.GetChartElement x, y, IDNum, a, b
If IDNum = xlDataLabel Then
On Error Resume Next
ActiveChart.Shapes("LeaderLine_" & a & "_" & b).Delete
On Error GoTo 0
bLabel = True
Set pt = ActiveChart.SeriesCollection(a).Points(b)
Set shpLeaderLine = ActiveChart.Shapes.BuildFreeform(msoEditingAuto, pt.Left, pt.Top)
With shpLeaderLine
Select Case pt.Left
Case Is < pt.DataLabel.Left
.AddNodes msoSegmentLine, msoEditingAuto, pt.DataLabel.Left - lKink, pt.DataLabel.Top + pt.DataLabel.Height / 2
.AddNodes msoSegmentLine, msoEditingAuto, pt.DataLabel.Left, pt.DataLabel.Top + pt.DataLabel.Height / 2
Case Is > pt.DataLabel.Left + pt.DataLabel.Width
.AddNodes msoSegmentLine, msoEditingAuto, pt.DataLabel.Left + pt.DataLabel.Width + lKink, pt.DataLabel.Top + pt.DataLabel.Height / 2
.AddNodes msoSegmentLine, msoEditingAuto, pt.DataLabel.Left + pt.DataLabel.Width, pt.DataLabel.Top + pt.DataLabel.Height / 2
Case Else
Select Case pt.Top
Case Is < pt.DataLabel.Top
.AddNodes msoSegmentLine, msoEditingAuto, pt.DataLabel.Left + pt.DataLabel.Width / 2, pt.DataLabel.Top
Case Is > pt.DataLabel.Top + pt.DataLabel.Height
.AddNodes msoSegmentLine, msoEditingAuto, pt.DataLabel.Left + pt.DataLabel.Width / 2, pt.DataLabel.Top + pt.DataLabel.Height
Case Else
bLabel = False
End Select
End Select
If bLabel Then
Set shp = .ConvertToShape
With shp
.Name = "LeaderLine_" & a & "_" & b
.Line.ForeColor.ObjectThemeColor = msoThemeColorBackground1
End With
End If
End With
End If
End Sub
I use the Workbook_Open event to trigger this:
Option Explicit

Dim myChart As New clsChart

Private Sub Workbook_Open()

If Application.Version < 15 Then
    Set myChart.clsChart = Sheet1.ChartObjects("Chart 1").Chart
End If
End Sub
I can't say I fully understand Class Objects yet. For instance, I'd like to amend this code so that it works on multiple charts. I know the answer to this will be buried within Chip Pearson's exhaustive but dense page at http://www.cpearson.com/excel/classes.aspx ...but I'm too dense to absorb all this. I was kinda hoping you'd find it for me ;-)
I also note that the code doesn't always trigger for some reason, when moving the data label. I suspect it's because I'm still moving the mouse at the time that I release the click button, as this only seems to happen when I'm moving the data label from left to right. Anyone got any pointers on this?
Here's the file:
Long ago I wrote a tutorial about chart events. So long ago that the site that hosted it isn’t there any longer. I am rewriting the tutorial, but in the meantime, you can read it on the Wayback machine:
http://web.archive.org/web/20120112080404/http://www.computorcompanion.com/LPMArticle.asp?ID=221
This tutorial shows you how to set up chart events for multiple chart objects. It’s probably easy enough to use the Workbook_SheetActivate and Workbook_SheetDeactivate events to create and destroy an array of instances of event-enabled charts.
Thanks Jon. Wow, that was so long ago that computer was spelled computor.
I’ve been thinking about this problem I detailed above:
the code doesn’t always trigger for some reason, when moving the data label. I suspect it’s because I’m still moving the mouse at the time that I release the click button.
I think the only way around this is – in addition to redrawing the leader line via a MouseUp event – also record if a data label was selected on MouseDown event, and redraw the associated leader line say 2 seconds later via an application.ontime approach – regardless of the fact that it was probably correctly redrawn already.
“Computor” was a play on computer + tutor.
Chart events are not entirely reliable. Sometimes the MouseUp or MouseDown doesn’t fire as expected, so you have to use MouseMove and check for no key being pressed (which means you must have released it). It’s a bit of a pain. I had a bunch of these workarounds figured out back in Excel 2000, and they kind of worked through 2003, and then Microsoft rearranged the glitches. I ditched the event-driven things I was working on, and only recently have started working on them again.
I can’t fathom why MS haven’t exposed embedded charts to the same events that are available to charts in chart sheets. Who the hell uses chart sheets? Probably the same people that use macro sheets!
And I can’t fathom why the hell you can’t effortlessly tell what chart element is selected. I mean c’mon…I have to get Excel to work it out via X and Y coordinates? Pah.
Hey, the MouseMove event works a treat…I still have the MouseUp event – which instantly redraws the new leader line 9 times out of 10. But the MouseMove event is a handy backup, which redraws the leader line 10 times out of 10, albeit with a delay. But that delay is only noticeable 1 time out of 10.
Thanks Jon – this is the best help forum I ever posted on!
Jon, that article is unbelievably well written – even by your standard. Can’t wait to see a rewrite up on your site.
Question: You use event handlers to trigger the Set_All_Charts and Reset_All_Charts routines. Is there a particular reason why you bother to call Reset_All_Charts at all? What’s the harm in leaving them activated? Is this simply good programming practice? Or is there some other reason?
Great work Jeff.
One way to handle multiple charts on a sheet is to store object references in a collection.
In Thisworkbook module you can use a collection to store objects for each chartobject on a sheet. Make use of the Activate event to update.
Option Explicit

Private m_colChtEvts As Collection

Private Sub m_ChartEvents(OnSheet As Object)
Dim myChart As New clsChart
Dim objCht As ChartObject
Set m_colChtEvts = New Collection
For Each objCht In OnSheet.ChartObjects
Set myChart = New clsChart
Set myChart.clsChart = objCht.Chart
m_colChtEvts.Add myChart, CStr(m_colChtEvts.Count + 1)
Next
End Sub
Private Sub Workbook_BeforeClose(Cancel As Boolean)
Set m_colChartEvents = Nothing
End Sub
Private Sub Workbook_Open()
If Val(Application.Version) < 15 Then m_ChartEvents ActiveSheet End If End Sub Private Sub Workbook_SheetActivate(ByVal Sh As Object) If Val(Application.Version) < 15 Then m_ChartEvents Sh End If End Sub In the class module I would replace Activechart with clsChart
clsChart.GetChartElement x, y, IDNum, a, b
In order to move a single data label you first need to select the datalabels for the series and then the individual data label, even if there is only 1 datalabel per series. Perhaps this is the problem you are seeing?
correction to typo
Private Sub Workbook_BeforeClose(Cancel As Boolean)

    Set m_colChtEvts = Nothing

End Sub
Jeff –
The same events are exposed, but an embedded chart doesn’t have the built-in class module the way a chart sheet does. So you have to work your own class magic.
The X and Y thing lets you know what element was clicked on, before it’s selected. You can use Selection to find out what’s selected. But this is nice, because in code you can move things without having to select them. Like a single data label, instead of making the user select it (two clicks) your code can handle it with the first click.
Andy uses a collection for all the chart objects on the sheet, whereas I used an array. Tomato, tomahto.
It always seems like good practice to reset the charts, same as setting your object variables to nothing when you’re done with them.
Jeff: probably a good idea to include a terminate event in the class that sets the object references to nothing. Especially if you’re going to have more than one instance of the class.
@ Andy. Have replaced all instances of Activechart with clsChart, as suggested. Thanks.
In order to move a single data label you first need to select the datalabels for the series and then the individual data label, even if there is only 1 datalabel per series. Perhaps this is the problem you are seeing?
No, I don’t think that’s it. The cause I’m pretty sure is the fact that I’m still moving the mouse when I let go of the mouse button, meaning the coordinates from the mouse-up event don’t match the datalabel coordinates. Adding a MouseMove routine ensures that this gets taken care of whenever it happens.
@Jan Karel, Jon: I’m glad I have some good programmers to instill those good programming practices into me. Thanks, guys.
Thanks to the suggestions above, I made some changes to the code in the Class Module. I also added a check: is the resulting leader line long enough to bother plotting? Excel 2013 does the same thing.
This is just a bit of Pythagoras, to check that the length of the hypotenuse formed by the Leader Line is greater than some minimum constant, lGap:
Here’s what I ended up with in the Class Module:
Option Explicit Public WithEvents clsChart As Chart Private Sub clsChart_Mouseup(ByVal Button As Long, ByVal Shift As Long, ByVal x As Long, ByVal y As Long) Dim IDNum As Long Dim lngSeries As Long Dim lngPoint As Long clsChart.GetChartElement x, y, IDNum, lngSeries, lngPoint If IDNum = xlDataLabel Then DrawLeaderLine clsChart, lngSeries, lngPoint End Sub Private Sub clsChart_Mousemove(ByVal Button As Long, ByVal Shift As Long, ByVal x As Long, ByVal y As Long) Dim IDNum As Long Dim lngSeries As Long Dim lngPoint As Long clsChart.GetChartElement x, y, IDNum, lngSeries, lngPoint If IDNum = xlDataLabel Then DrawLeaderLine clsChart, lngSeries, lngPoint End Sub Private Sub DrawLeaderLine(clsChart As Chart, lngSeries As Long, lngPoint As Long) Dim pt As Point Const lKink = 5 Const lGap = 20 Dim lX As Long Dim lY As Long Dim bLabel As Boolean Dim shpLeaderLine As FreeformBuilder Dim shp As Shape On Error Resume Next clsChart.Shapes("LeaderLine_" & lngSeries & "_" & lngPoint).Delete On Error GoTo 0 bLabel = True Set pt = clsChart.SeriesCollection(lngSeries).Points(lngPoint) Set shpLeaderLine = clsChart.Shapes.BuildFreeform(msoEditingAuto, pt.Left, pt.Top) With shpLeaderLine Select Case pt.Left Case Is < pt.DataLabel.Left lX = pt.DataLabel.Left lY = pt.DataLabel.Top + pt.DataLabel.Height / 2 .AddNodes msoSegmentLine, msoEditingAuto, lX - lKink, lY .AddNodes msoSegmentLine, msoEditingAuto, lX, lY Case Is > pt.DataLabel.Left + pt.DataLabel.Width lX = pt.DataLabel.Left + pt.DataLabel.Width lY = pt.DataLabel.Top + pt.DataLabel.Height / 2 .AddNodes msoSegmentLine, msoEditingAuto, lX + lKink, lY .AddNodes msoSegmentLine, msoEditingAuto, lX, lY Case Else Select Case pt.Top Case Is < pt.DataLabel.Top lX = pt.DataLabel.Left + pt.DataLabel.Width / 2 lY = pt.DataLabel.Top .AddNodes msoSegmentLine, msoEditingAuto, lX, lY Case Is > pt.DataLabel.Top + pt.DataLabel.Height lX = pt.DataLabel.Left + pt.DataLabel.Width / 2 lY = pt.DataLabel.Top + pt.DataLabel.Height .AddNodes msoSegmentLine, msoEditingAuto, lX, lY Case Else bLabel = False End Select End Select If bLabel Then 'check that resulting leader line is long enough to bother with If (Abs(lX - pt.Left) ^ 2 + Abs(lY - pt.Top) ^ 2) ^ 0.5 > lGap Then Set shp = .ConvertToShape With shp .Name = "LeaderLine_" & lngSeries & "_" & lngPoint .Line.ForeColor.ObjectThemeColor = msoThemeColorBackground1 End With End If End If End With End SubOK, interesting, but not working at all in XL07. Wish it did, I could use it right away!
First, I had to change the formulas in the basic sheet… no aggregate for me. Because I can’t use the “ignore errors” I don’t get the same numbers as the example, but at least I’m getting text now for the labels.
The code doesn’t seem to be working, but I haven’t looked into that yet.
The DataLabel.Height and DataLabel.Width properties are not available in Excel 2007. I’m not sure if there is a workaround to this. I had the same issue with my Chart Alignment add-in, and am just bypassing it for 2007. It’s not as critical for that add-in.
For Jeff’s utility the elements size (height/width) is more critical, so hopefully there is a solution.
Jeff – Great function btw! I’m sure this will come in handy.
You could use the DataLabel.Font.Size property to get the approximate height, and len(DataLabel.Text) to get the approximate width. This would require you to create a formula to convert both variables to points, and the height and width would still be an approximation depending on the font type.
This would NOT work for labels that have multiple lines though. I’m still not sure how you would figure that.
I remember Excel 2007. Not fondly. Because I was trying to learn VBA at the time.
Note that I’ve replaced this:
.Line.ForeColor.ObjectThemeColor = msoThemeColorBackground1
…with this:
.Line.ForeColor.RGB = pt.DataLabel.Format.TextFrame2.TextRange.Font.Fill.ForeColor.RGB
…so that the leader lines are always the same color as the textbox text. Otherwise you won’t see the leaderlines on a chart with a white background.
@Jon,
The trick to getting datalabel width and height is to force the data label off of the chart by setting left and top to chartarea width and height. The data labels will not actually go out of the chart so by reading the new left and top properties you can calculate the differences.
Ohhh, that’s clever.
That’s a very cool trick Andy! Thanks!
Hi Jeff,
An excellent piece of code. I noticed that when I move a trendline equation box, that is throws an error as the lngSeries & lngPoint are zero.
I have added this check to the start of the Sub DrawLeaderLine:
    If lngSeries = 0 Or lngPoint = 0 Then CleanExit

    On Error Resume Next

    clsChart.Shapes("LeaderLine_" & lngSeries & "_" & lngPoint).Delete

    On Error GoTo 0
....
CleanExit:
Set pt = Nothing
Set shpLeaderLine = Nothing
End Sub
Hi Kane. Thanks for that. Even with your amendment, I get a Method ‘GetChartElement’ of object ‘_Chart’ failed error. I wonder why I get this error, but you do not???
To get around this, I added an On Error Resume Next to the clsChart_Mouseup and clsChart_Mousemove event handlers:
On Error Resume Next
clsChart.GetChartElement x, y, IDNum, lngSeries, lngPoint
If Err.Number = 0 Then
    If IDNum = xlDataLabel Then DrawLeaderLine clsChart, lngSeries, lngPoint
End If
…which means I don’t need your amendment, because the DrawLeaderLine sub doesn’t get called in this circumstance.
Note I opened the original example file in 2007, and all the values in the table were #Name and #Value. Was there something missing??